What's New in 6.3


What's New in 6.3 |
|
|
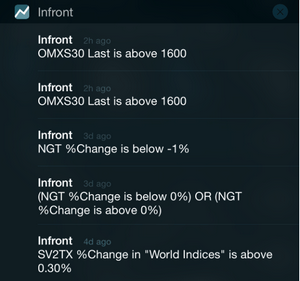
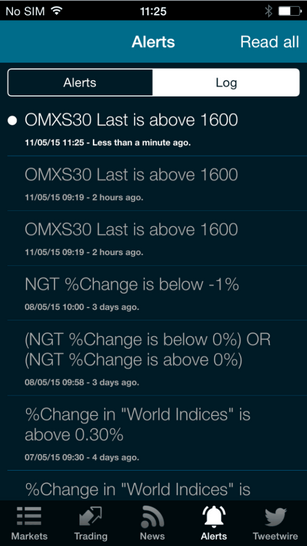
Cross-Device Alerts Alerts on single symbols will be stored in the cloud and triggers will be pushed to any device you are using; other computers where you use Infront, iPhone, iPad or Android phones. Alerts on calendar events and news are still local to your computer, meaning they will only be triggered when you use Infront on that computer. Cross-Device alerts can be placed from the instrument right click menu by following the "Alert me If" menu option. All alerts will show up in the top right of your terminal as a notification icon. The number will indicate how many unread alerts you have.
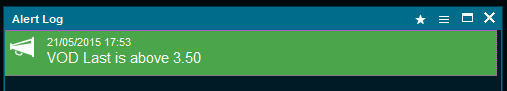
Click on the alert icon to see the log. All messages will be marked as "read" automatically as you see them in the Alert Log.
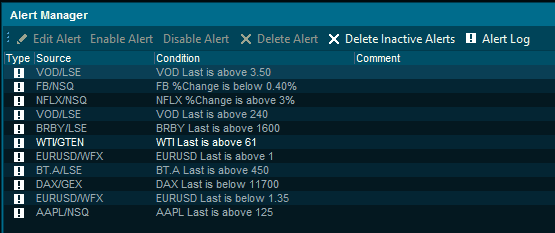
The Alert Manager, allows you to manage all events which can trigger alerts.
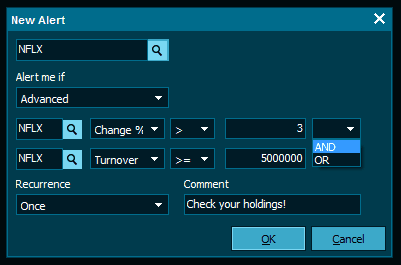
By using AND and OR statement, you can combine the different criteria as a condition of the alert triggering.
Cross-Device Alerts Support on iPhone and iPadKeep yourself updated by receiving alerts on the move. As long as you have not logged out of the Infront application on your mobile device, you will be able to both receive and place alerts on your iPhone and iPad. You will receive alerts if the device has been registered on your account. By logging in on Infront’s app the devices will be registered to your user account, and you can receive alert even when the app is not running. If you explicitly log out of the app, the device will no longer receive alerts.
Manage your alerts directly from your iPhone or iPad. The easy to use interface, helps you stay in control of what's happening.
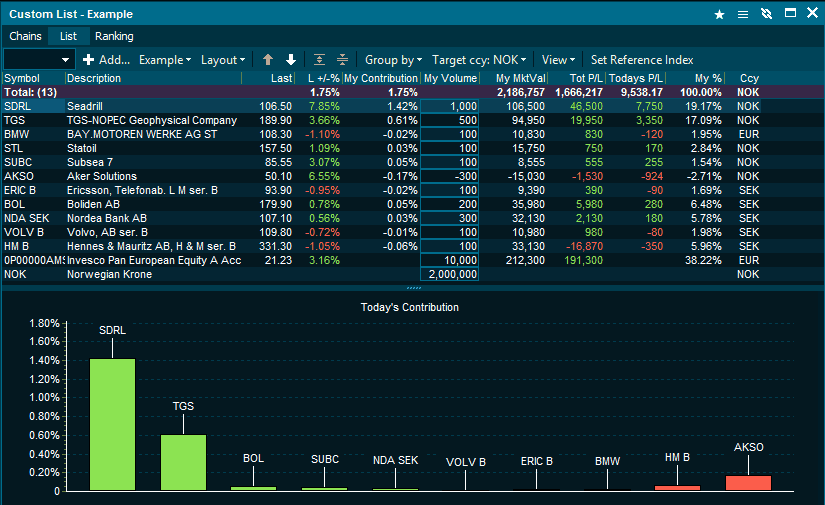
Portfolio ViewThere is a new Portfolio View in the custom list module which allows you to enter holdings for your positions, and be able to see P/L, Invested Value, Market Value and Totals. You can group the assets by currency, asset class, sectors and also your own holdings categories. You can chart your grouped and non-grouped holdings as bar and pie charts, giving you a visual representation of the status of your portfolio. Add charts by using one of the default "Portfolio View" layouts, or by going to the "View" menu. Quick Start:Open a new custom list from the main menu.
The invested amount and market value will be calculated automatically, and you can switch to the "Results" Layouts to see check the performance. Pro tip: Calculate your average price, volumes and Invested amount automatically by entering your desired weightings for each asset and then right-clicking in the window and choosing "Edit --> Distribute Amount". Pro tip: If you have illiquid OTC assets in your portfolio, use the "My Market Price" column, to enter a custom market price for the asset. My Market Price will always override any available last price for the instrument. You can add the column from the "Add Symbol Columns" window.
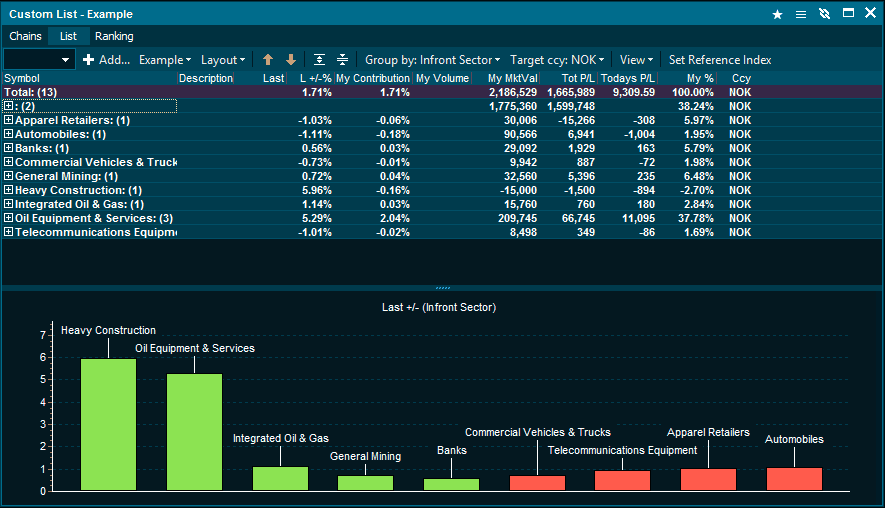
Group your holdingsYou can group your holdings in your portfolio from the drop-down menu called "Group By".
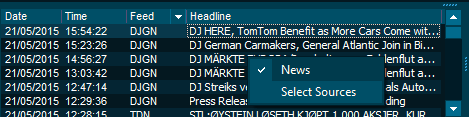
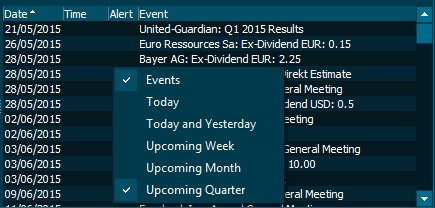
The chart will by default the same grouping as you have in the the Grid, but should you wish to group it by any other category, just right click on the chart and choose. News and EventsYou will see news and events related to your instruments in the "News" and "Events" panel. You can customize the sources for your news by right-clicking in the panel and choosing "Sources". You can adjust the time period of upcoming events by right-clicking in the "Events" panel and choosing your desired period.
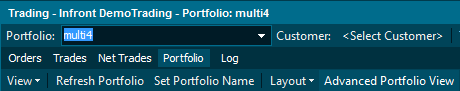
Advanced Portfolio ViewIn the Portfolio tab in the trading window, you will find a new button: "Advanced Portfolio View".
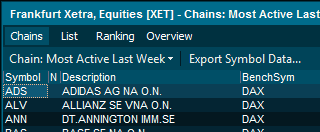
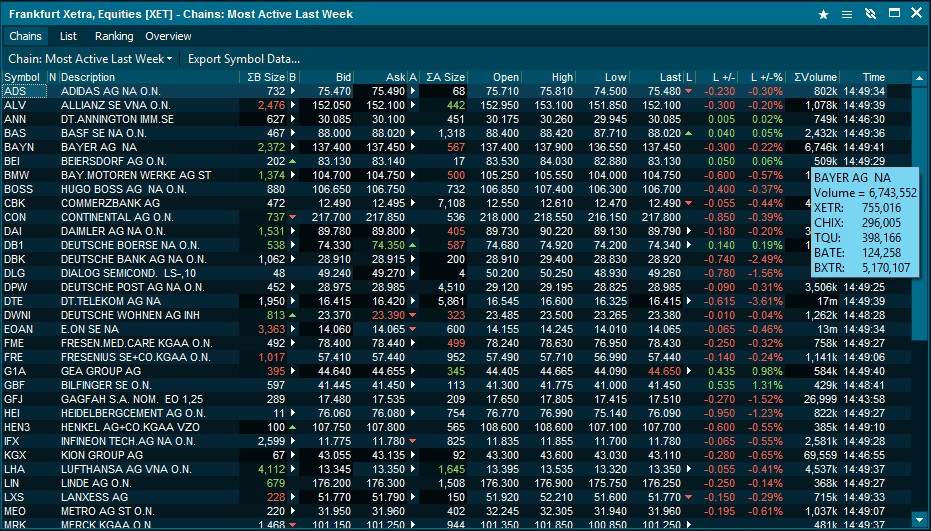
This will open up your entire trading portfolio in the custom list Portfolio view, allowing you to chart, group, see events and news related to your positions. Benchmark SymbolsMarket windows and custom lists now have a new column called "Benchmark Symbol". The benchmark symbol allows you to set a benchmark for any given instrument. By default, the main index for the home market of the instrument will be chosen, where available.
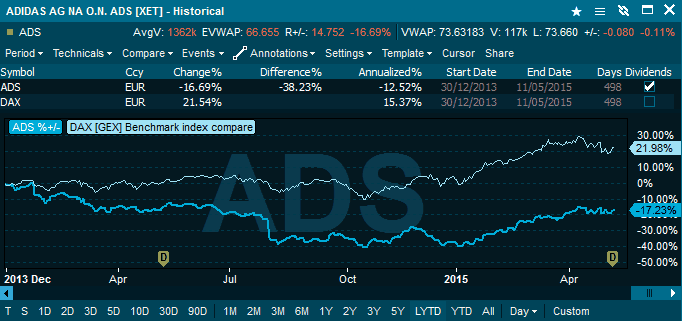
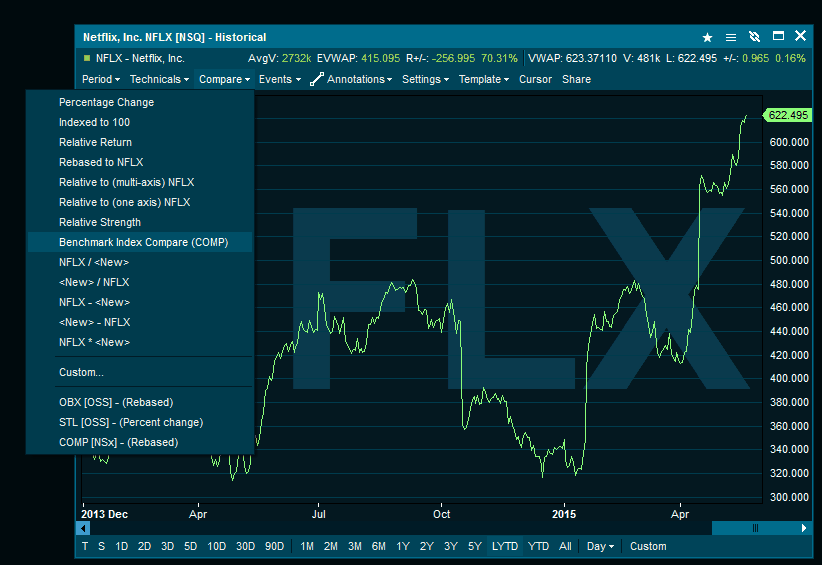
By double-clicking on the benchmark symbol "DAX" in the above example, a new chart will open showing you a benchmark compare chart. You can also modify the benchmark symbol by right clicking on the instrument in a market window or custom list. Then choose Other and choosing "Select Benchmark Symbol". In the Benchmark Compare chart, you can see annualized performance data for your instrument and the corresponding benchmark. Choose the time period you wish to annualize for in the chart period menu on the bottom of the chart. There is also a shortcut tick-box to automatically adjust for dividends.
Pro tip: You can modify the benchmark symbol by clicking on the benchmark symbol ("DAX" in this case) in the chart above. This will open the Search Benchmark window and allow you to change the benchmark symbol for the current instrument. Pro tip: You can also open the Benchmark Compare chart directly from the chart in the compare menu.
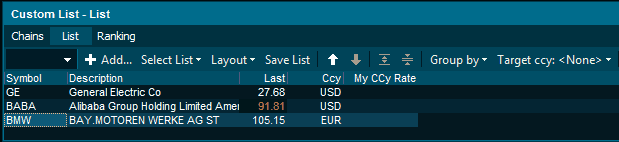
See Live Market Data In Any CurrencyIn your custom list, you can now choose to see your instruments market data in one of many currencies.
All Instruments in Local Currency
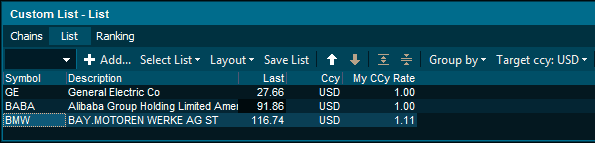
All Instruments in USD
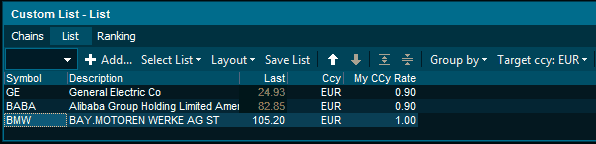
All instruments in EUR
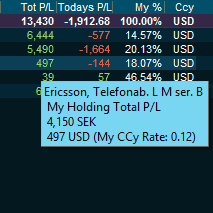
Smart Hints - Show Target Currency and Local CurrencySmart Hints allow you to see data both in the instrument's local currency, but also your target currency. We also provide the currency rate at which the price conversion was made giving you full transparency and control. In the case below, we are looking at Ericsson's Total P/L. We have chosen the target currency as USD and see this as $497. But we can still see the Total P/L for Ericsson in SEK (4,150 SEK) when hovering over the value with the mouse. We also see that the currency rate used is 0.12.
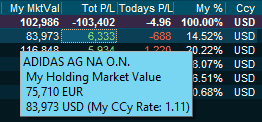
Another example, this time with Market Value is Adidas. Below, we are looking at the Market Value, with the target currency set to USD. We see this as $83,973 in our holdings, but hovering over the value also gives us the EUR Market Value of the position in Adidas (75,710 EUR) with a currency conversion of 1.11.
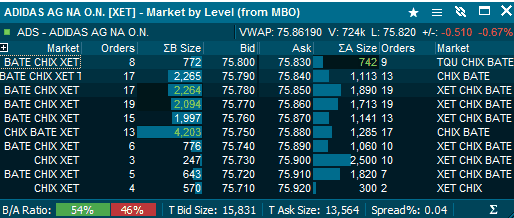
ConsolidationIf you have access to real-time data from both primary exchanges and MTFs, the data will automatically be consolidated in the terminal. The sigma-symbol Σ in the volume/turnover/size column indicates that the market data is consolidated.
Hovering over consolidated columns in the market window, will show you a summary of the values on the different exchanges. Below, the mouse is hovered over consolidated volume. You will get a dialog showing the volume traded on each individual venue you have access to.
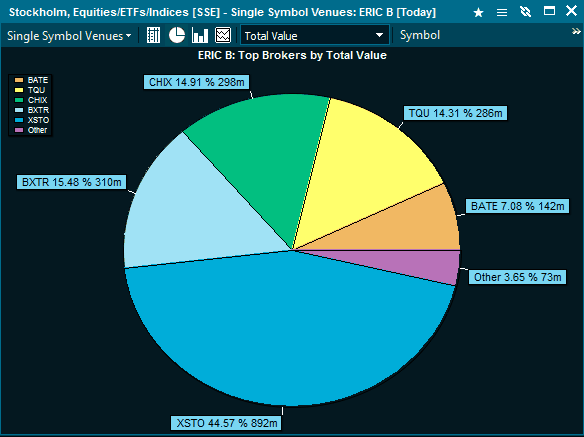
Venue Statistics Venue Statistics is available for all consolidated markets, showing the venue distribution for a market or a single symbol. You can find this window on the instrument right-click menu, select "Other", then "Venue statistics".
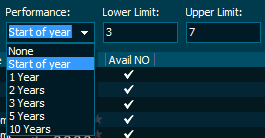
Fund improvementsNew fund search options allow you to search for funds based on Performance over a given period.
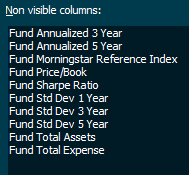
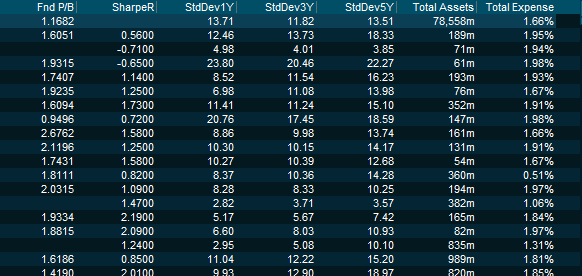
New fund columns give you valuable information directly in your custom list or market overview window.
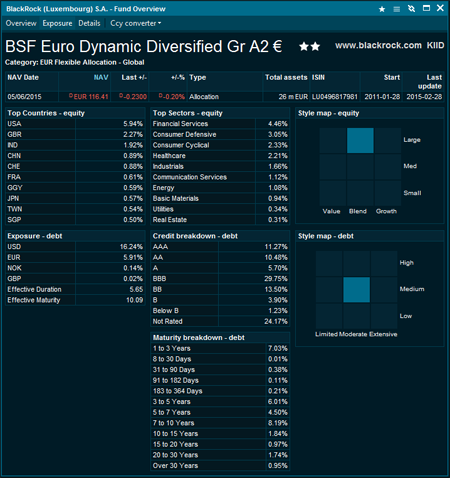
The exposure tab now also shows effective duration & maturity for fixed income instruments where available.
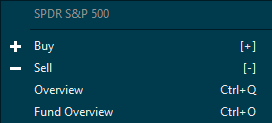
Quick access to fund overviewFrom version 6.3.50, you can also open the fund overview directly from the right click menu on any ETF or fund.
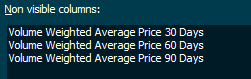
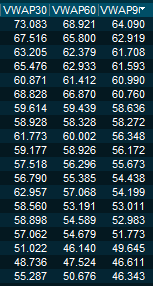
Other ImprovementsNew market columns are supported by most asset classes. You can now add and see 30 day, 60 day and 90 day Volume Weighted Average Price in your market window or custom list.
New columns available from version 6.3.50Our new market data columns keep you informed of interesting price movements allowing you to make relevant comparisons between instruments.
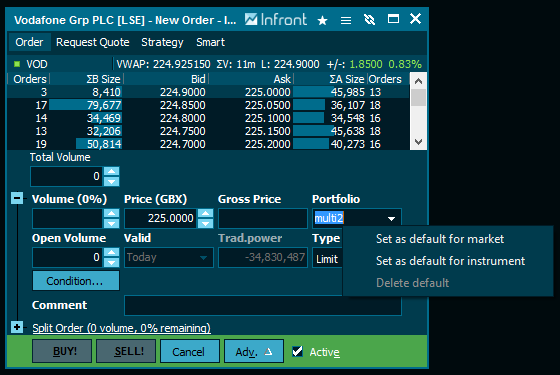
New Trading FeaturesAvailable from version 6.3.50By right-clicking in the portfolio field in an order entry window, you can set the default account/portfolio per market and per instrument.
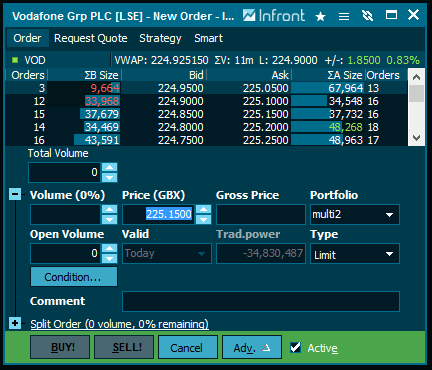
The mouse scroll-wheel can be used in the price field to change the price quickly and easily.
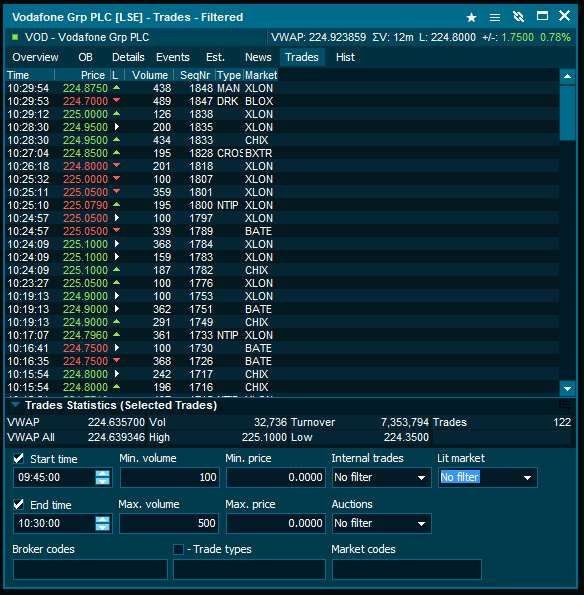
VWAP CalculatorAvailable from version 6.3.50Volume weighted average price and several other useful Trades statistics can easily be calculated using the trades filter. Open the symbol overview window, and navigate to the trades tab. Right-click and choose "Show Filter". Set the desired time frame and make use of parameters to include/exclude auctions, market codes and certain trade types such as Dark Trades, internal trades etc.
|