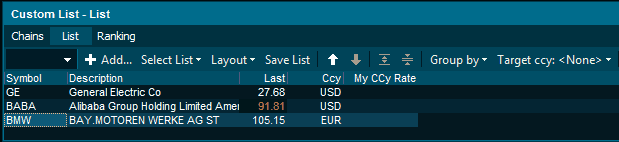
Custom List


Custom List |
|
DescriptionThe Custom List window works in the same way as the Market Window. The main difference however is that the Custom List Window makes it possible to define symbols from different markets you have access to. You can open unlimited number of Custom List windows. Custom list has layouts which allow you to enter holdings for Portfolios and see performance results in both tabular and chart formats. You are also able to follow news and upcoming events related to instruments in your list. How to open
ChainsThe first tab gives you access to Chains which are pre-defined chains of symbols from the Infront servers. Read more ListThe list tab enables you to add symbols from any market you have access to, or open an existing list you have saved in the cloud from before. Adding symbolsTo add symbols type the name in the blank field and press enter. If you do not know the instrument code click on the Add button. To open the search module, just click on the Add button. Deleting symbolsRight click and choose Edit | Delete or user the keyboard shortcut (Del) to delete a symbol from the Custom List. Deleting Entire ListsRight click and choose Edit | Delete List to delete the whole list. Adding Custom HeadlinesCustom headlines may be inserted by selecting Other | Add Headline from the right click menu.
The text and background color of all headlines can be customized in the Edit colors dialog. Notice that in a list with headlines, sorting by clicking on the column captions have been disabled.
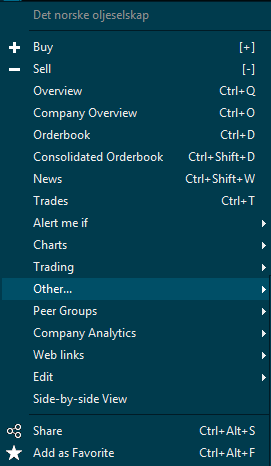
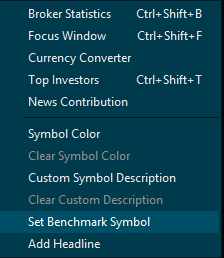
Highlighting and modifying a symbolCustom Background colorIt is possible to define a custom background color for a symbol by right clicking on an instrument and choosing Other | Symbol color from the right click menu.
Note: For strong background colors, the positive and negative change colors are disabled to enhance readability. if a soft pastel color is chosen, the positive and negative change coloring is retained. To clear a custom background color, right click on the instrument and choose Other | Clear Symbol color. Custom Symbol DescriptionIt is possible to define a custom description for a symbol by right clicking on the instrument and choosing Other | Custom Symbol description from the menu. Custom symbol descriptions are persistent and will be used in all other window types.
Note: To reduce potential confusion all custom descriptions are indicated with an asterisk (*) prefix. To return to the server-defined description select Other | Clear Custom Description from the right click menu. Ranking The Ranking tab gives you access to real-time intraday ranking for today's gainers, losers and most traded symbols. You can use a chain as a source, or your own list. ColumnsEditing ColumnsEach column can be edited directly. Right-click on the column header to open the menu and choose Select Columns. There are many great columns to choose from. Some are scenario specific and will only work on certain markets or asset classes. SortingTo sort on a column double-click on the column header. The sorting will happen immediately. Menu iconsList Trade Ticker The List trade ticker will display a Trade Ticker with the instruments you have added in the Custom list window. Right-click while you are in the window and choose List Trade Ticker. Export Symbol Data Export symbol data allows you to export the list of instruments to a file in different formats.
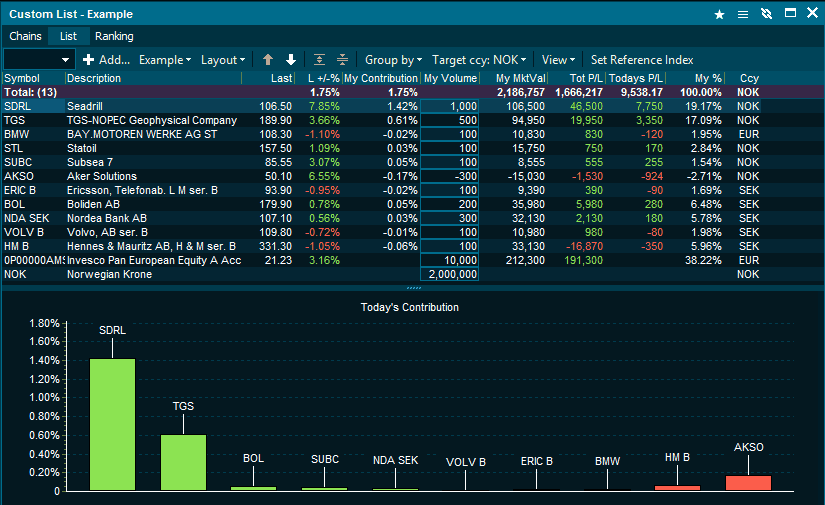
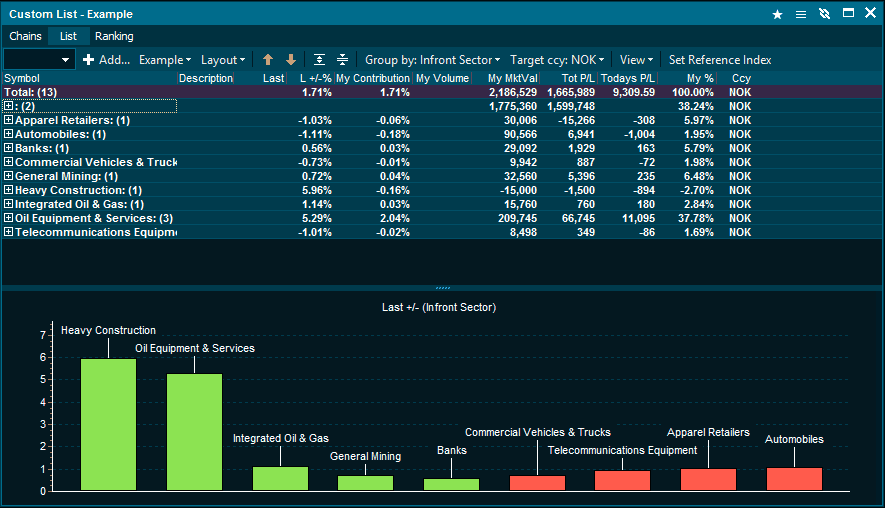
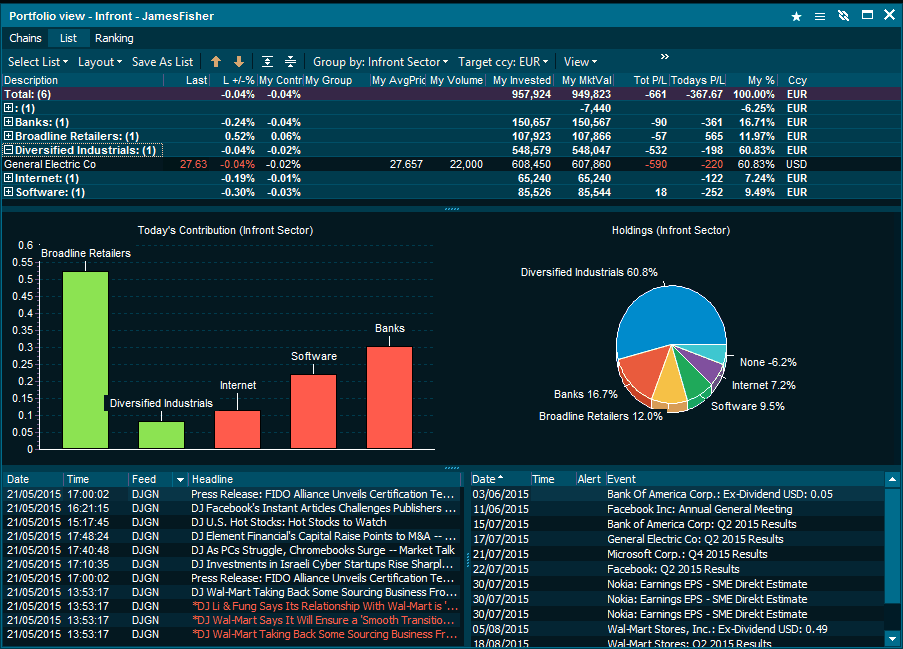
Portfolio ViewThe Portfolio View in the custom list module allows you to enter holdings for your positions, and be able to see P/L, Invested Value, Market Value and Totals. You can group the assets by currency, asset class, sectors and also your own holdings categories. You can chart your grouped and non-grouped holdings as bar and pie charts, giving you a visual representation of the status of your portfolio. Add charts by using one of the default "Portfolio View" layouts, or by going to the "View" menu. Quick Start:Open a new custom list from the main menu.
The invested amount and market value will be calculated automatically, and you can switch to the "Results" Layouts to see check the performance. Pro tip: Calculate your average price, volumes and Invested amount automatically by entering your desired weightings for each asset and then right-clicking in the window and choosing "Edit --> Distribute Amount". Pro tip: If you have illiquid OTC assets in your portfolio, use the "My Market Price" column, to enter a custom market price for the asset. My Market Price will always override any available last price for the instrument. You can add the column from the "Add Symbol Columns" window.
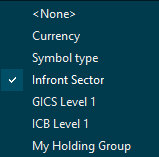
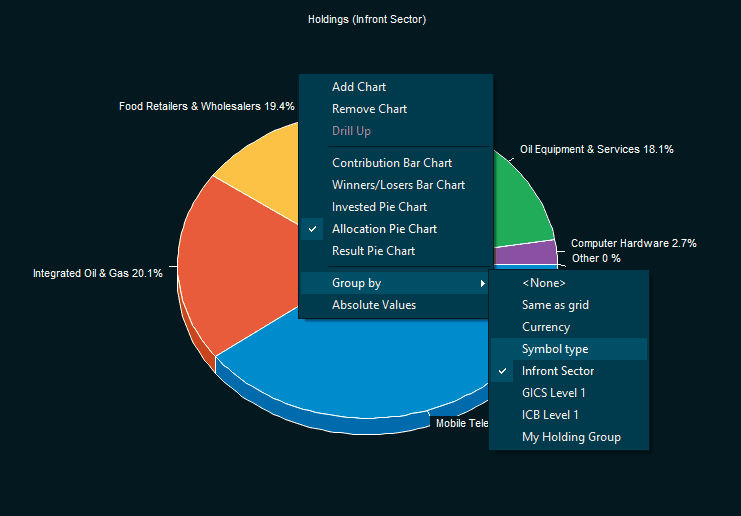
Group your holdingsYou can group your holdings in your portfolio from the drop-down menu called "Group By".
The chart will by default the same grouping as you have in the the Grid, but should you wish to group it by any other category, just right click on the chart and choose.
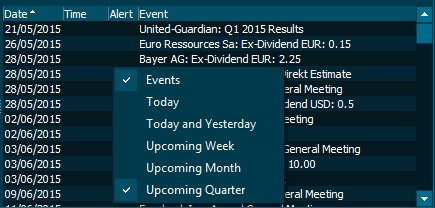
News and EventsYou will see news and events related to your instruments in the "News" and "Events" panel. You can customize the sources for your news by right-clicking in the panel and choosing "Sources". You can adjust the time period of upcoming events by right-clicking in the "Events" panel and choosing your desired period.
Advanced Portfolio ViewIn the Portfolio tab in the trading window, you will find a new button: "Advanced Portfolio View".
This will open up your entire trading portfolio in the custom list Portfolio view, allowing you to chart, group, see events and news related to your positions. |
| 1. | Open Your Custom List |
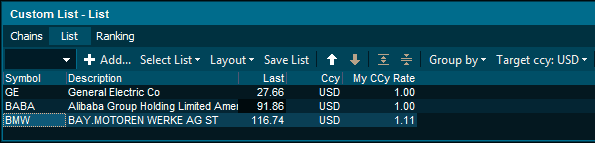
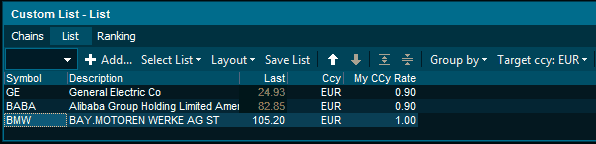
| 2. | Choose your Target Currency from the "Target ccy" menu. |
| 3. | Remove the tick-box for "Only Convert Summaries" in the "Target ccy" menu. |
All Instruments in Local Currency
All Instruments in USD
All instruments in EUR
All instruments in JPY
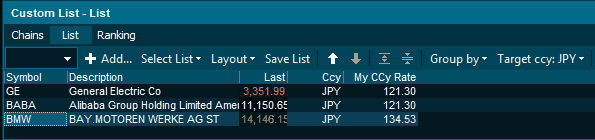
Smart hints allow you to see data both in the instrument's local currency, but also your target currency. We also provide the currency rate at which the price conversion was made giving you full transparency and control.
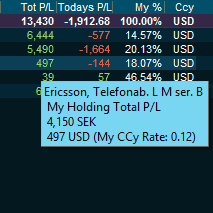
In the case below, we are looking at Ericsson's Total P/L. We have chosen the target currency as USD and see this as $497. But we can still see the Total P/L for Ericsson in SEK (4,150 SEK) when hovering over the value with the mouse. We also see that the currency rate used is 0.12.
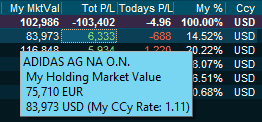
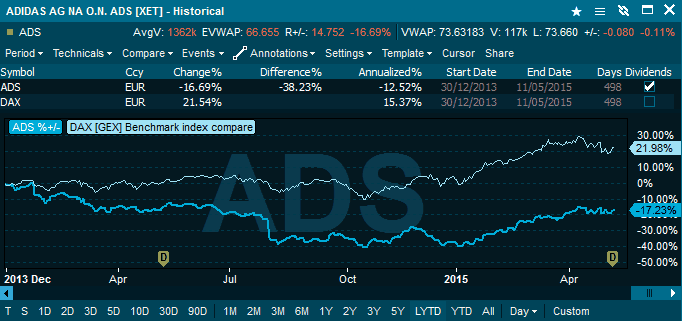
Another example, this time with Market Value is Adidas. Below, we are looking at the Market Value, with the target currency set to USD. We see this as $83,973 in our holdings, but hovering over the value also gives us the EUR Market Value of the position in Adidas (75,710 EUR) with a currency conversion of 1.11.