What's New in 6.4


What's New in 6.4 |
|
|
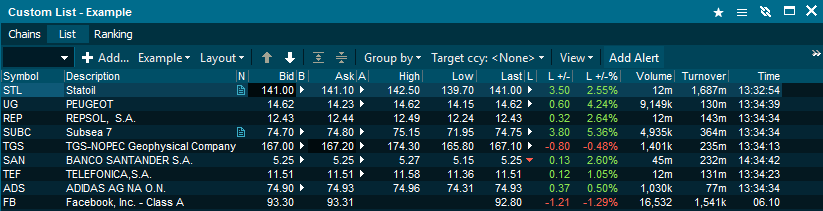
Improved Alerts We have added the possibility to place alerts on custom lists and chains. These alerts are also cross-device, meaning Infront will push alerts to any device you are using; other computers where you use Infront, iPhone, iPad or Android phones. We have also added the ability to receive alerts by e-mail. Custom List AlertsOpen custom list from the main menu, and choose from one of your saved lists from the "Select List" drop-down menu, or create a new list of financial instruments you are interested in. Once your list is saved in the cloud, you will be able to click on "Add Alert" from the menu.
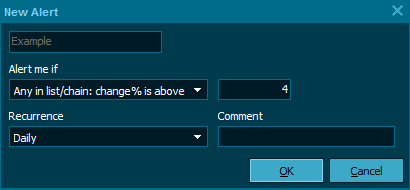
Enter your conditions which should trigger the alert. Infront's servers will monitor all the instruments in your list for your desired percent change move, daily and alert you when they happen.
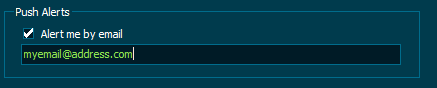
Chain AlertsAdding a chain alert happens in much the same way as a custom list alert. You can add chains for index constituents, commodities, market segments and more. E-mail AlertsYou can choose to receive alerts by e-mail in addition to notifications in the terminal and/or your mobile device. Simply click on "Change Alert Email" from the Alert Manager window (see below), or go in to Menu --> Tool --> Preferences --> Alerts to enter your e-mail address in the "Push Alerts" section.
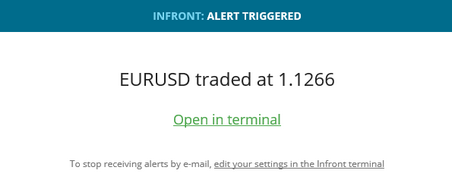
Once an alert has triggered, you will receive an e-mail with details regarding the alert.
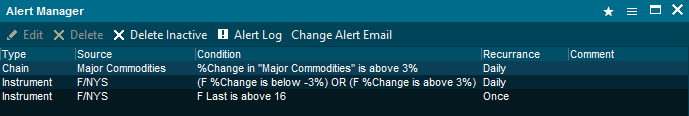
Alert ManagerAlert Manager provides more information, allowing you to see the type of alert you have placed and how how often you would like the condition to be checked (recurrance). You can also add or change your e-mail alert settings by clicking the button on the menu.
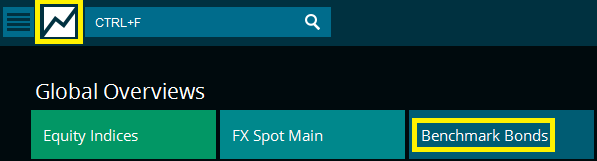
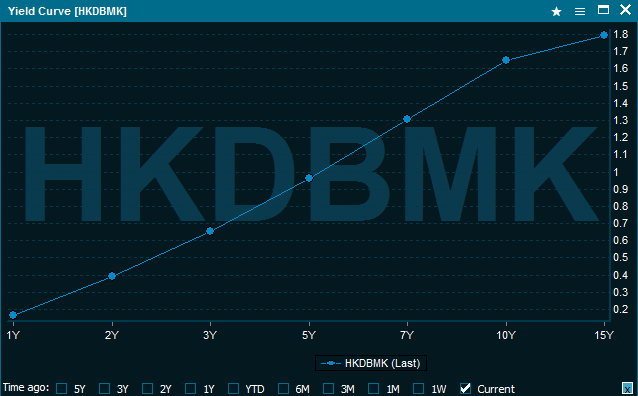
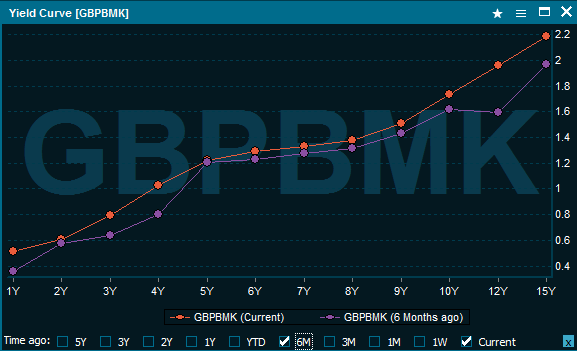
Improved Yield Curve Charts for Benchmark Bonds and Interest Rate Swaps (IRS)Opening relevant yield charts is now easier than ever, showing yield curves for benchmark bonds and interest rate swaps without having to select multiple instruments. You are also able to see multiple yield curves for the same asset class in the same window, and see historical yield curves. We have added setup options allowing you to customize the name of the chart, and also allowing you to choose between charting yields, bid, ask and more. Benchmark BondsFrom the Global Overview menu, choose Benchmark Bonds.
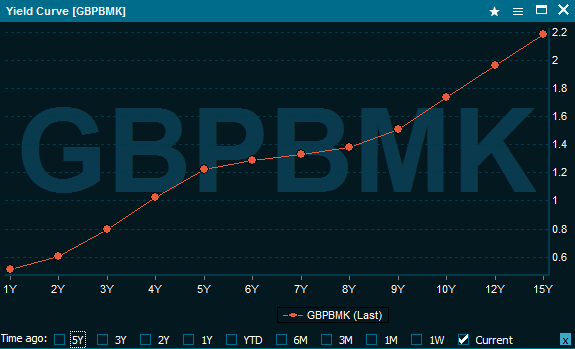
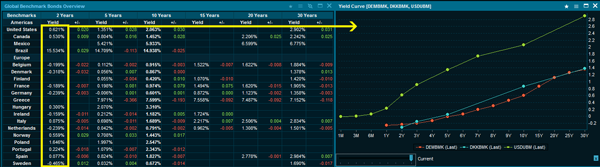
The "Global Benchmark Bonds Overview" will open. When clicking on a country name (such as United Kingdom), a yield curve chart will open.
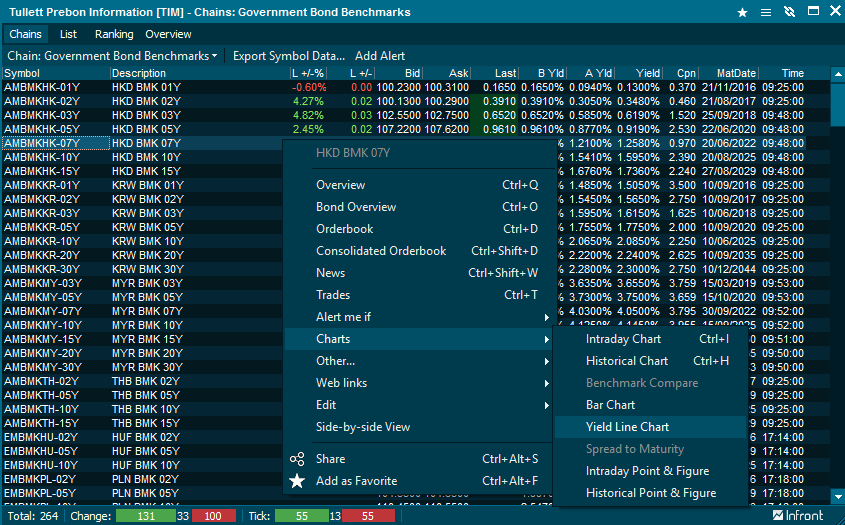
Tullet PrebonThe alternative to the "Global Benchmark Bonds Overview" window is to open the Tullet Prebon market window from Menu --> Market --> World --> Tullet Prebon, and choose Government Benchmark Bonds from the drop-down menu called "Select Chain". Right click on the benchmark bond that interests you, for example Hong Kong, and choose "Charts --> Yield Line Chart". The terminal will then automatically fetch all maturities for the HKD and show these in a yield curve chart.
Multiple Historical Yield Curves for one countryOnce you have opened a yield chart for a chosen country, you can choose to add historical yield curves by clicking in the check-boxes along the bottom of the window.
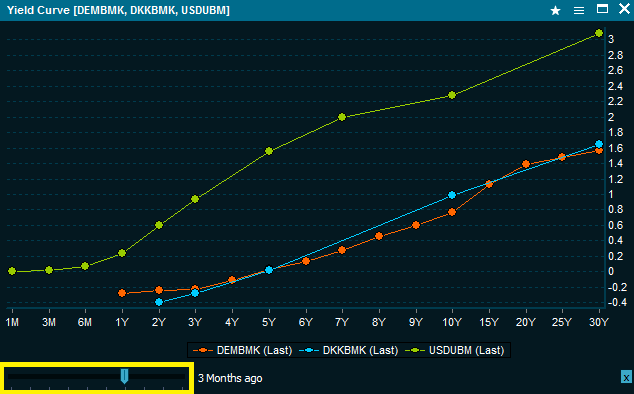
Comparing Multiple Country Benchmark Bonds in one Yield Curve ChartOnce you have opened a yield chart for a chosen country, you can add more countries by dragging and dropping from the desired country's "Yield" column in the "Global Benchmark Bonds Overview" window. Note: You can also drag-and-drop from the Tullet Prebon market window.
To see historical yield curves for your chosen countries, drag the slider on the bottom of the Yield Curve window.
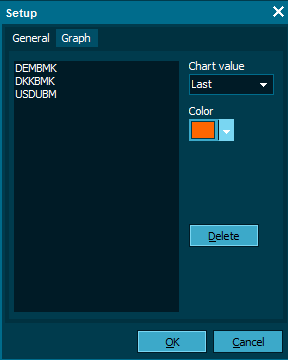
Yield Curve SetupYou have more options in the setup window of the Yield Curve window. In the graph tab, you can delete countries from your yield curve and also choose which chart values the yield curve should be display.
New Market ColumnsNew market columns are supported by most asset classes.
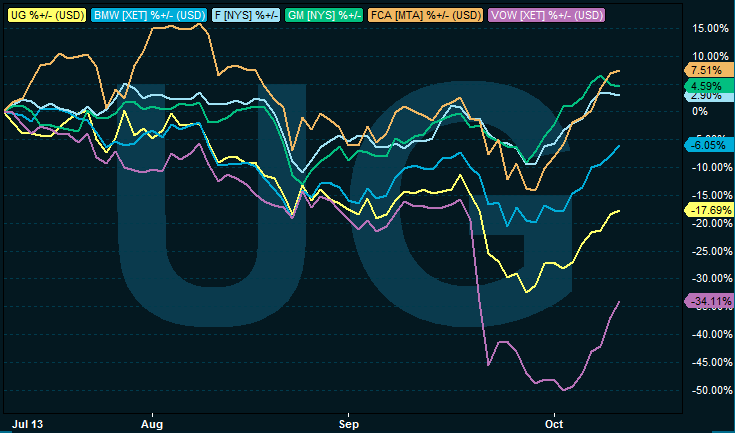
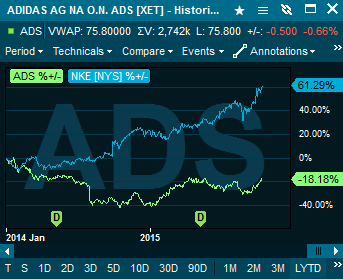
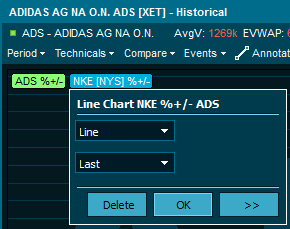
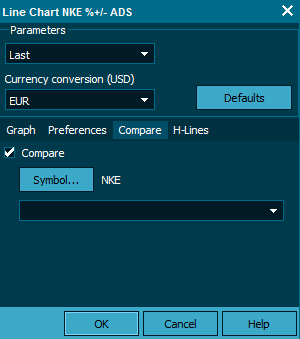
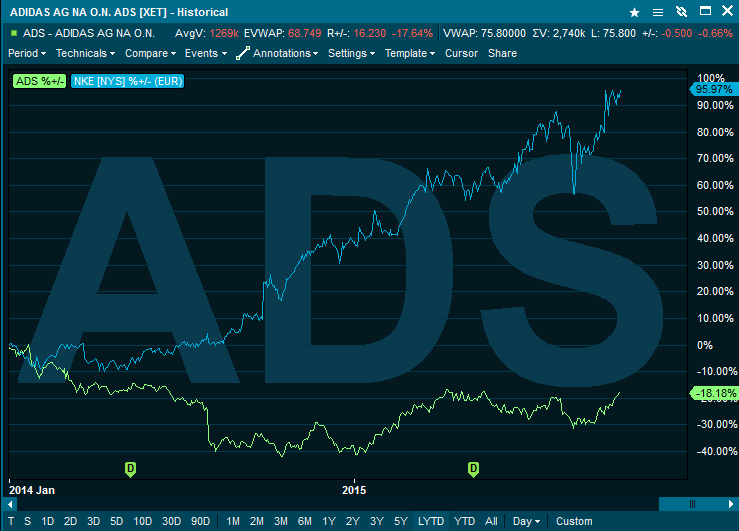
Currency conversion in chartsYou can set the currency for each instrument individually in the chart, allowing you to compare performance and price movements quickly and easily.
Above, we have an example comparing Peugeot, BMW, Ford Motor Company, General Motors Company, Fiat Chrystler Automobiles and Volkswagen AG. All percentage performance lines have been converted into USD in order to make a fairer performance comparison. Changing the currency of an instrument in a chartOpen a compare chart of two or more instruments that are of interest.
Click on the legend name of the instrument you would like to conver the currency of and click on the >> arrows. (Atlernatively: double click on the instrument's line in the chart )
Select the desired currency from the drop-down menu and click OK
The price movements of the instrument will automatically be calculated in the chosen currency and the results reflected in the chart.
Performance ImprovementsImprovement in speed and performance have been made in the following areas:
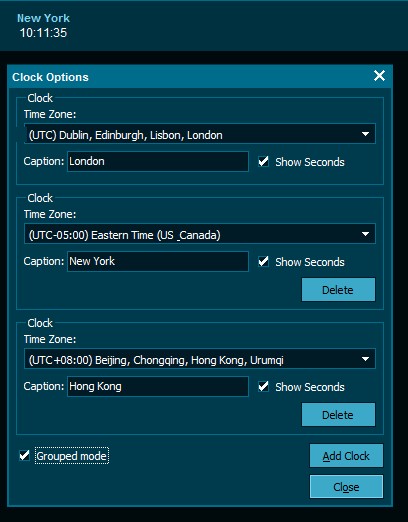
Other improvementsClock in Grouped ModeChoose whether the clocks in the Infront toolbar are shown individually, or in grouped mode. The grouped mode switches between clocks every 8 seconds.
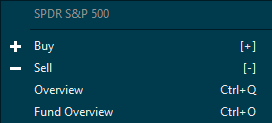
Fund Overview menu option available from version 6.3.50From version 6.3.50, you can open the fund overview directly from the right click menu on any ETF or fund.
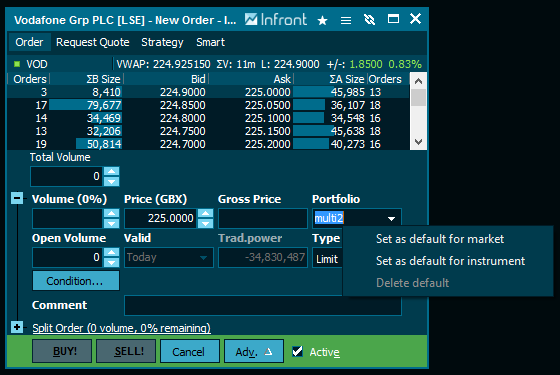
New Trading FeaturesAvailable from version 6.3.50By right-clicking in the portfolio field in an order entry window, you can set the default account/portfolio per market and per instrument.
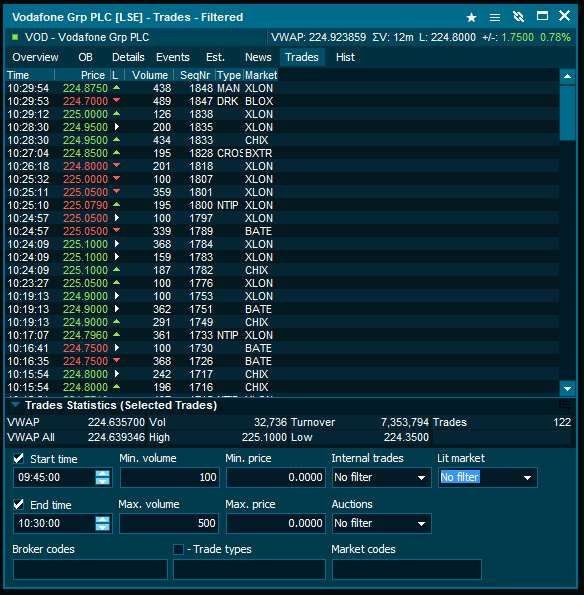
VWAP CalculatorAvailable from version 6.3.50Volume weighted average price and several other useful Trades statistics can easily be calculated using the trades filter. Open the symbol overview window, and navigate to the trades tab. Right-click and choose "Show Filter". Set the desired time frame and make use of parameters to include/exclude auctions, market codes and certain trade types such as Dark Trades, internal trades etc.
|