How to access
| • | Select Broker Statistics from the main menu, select the Market from the list, click OK and go to the first tab "Single Broker". Choose a broker from the drop-down list. |
| • | Right-click on any equity symbol, go to Other > Broker statistics, then change to the Single broker tab. If this menu option is not available, then broker statistics are not supported for that market. |
Description
Broker statistics for a Single Broker provides you with accumulated data for one selected broker. The information is displayed as columns, pie chart or line charts.
Table - Totals
The Table provides you with various statistics updated in realtime.
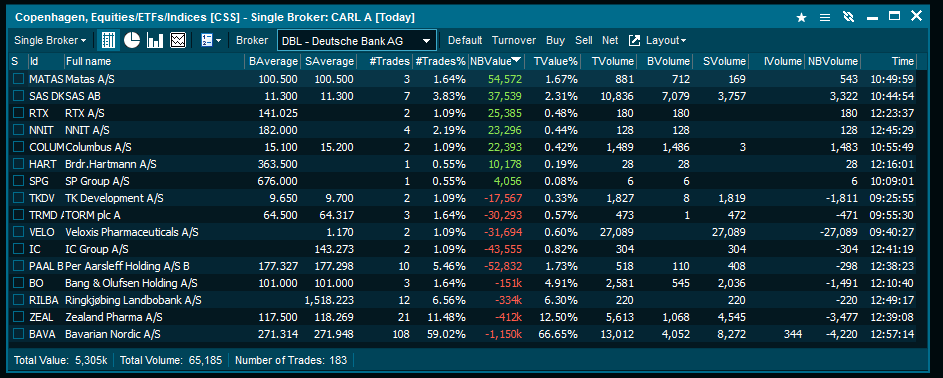
Available columns
| • | S (Checkbox for Timeline Selected) |
| • | Full name (The brokers name) |
| • | Time (time of last trade/update) |
| • | #Buys (Number of Buy Trades) |
| • | #Sells (Number of Sells Trades) |
| • | #Int Trades (Number Internal Trades) |
| • | #Trades (Total number of Trades |
| • | #Trades % (Trades shown in percent of total trades) |
| • | NB Value (Net Buy Value) |
| • | TValue% (Turnover Value in percentage) |
Pie - Totals
The pie chart provides data on the selected criteria visually.
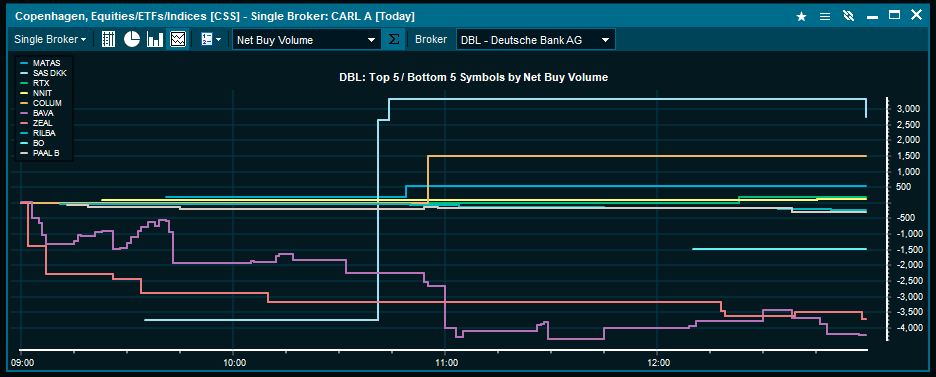
Timeline - Selected
The Timeline view enables you to select different brokers and see statistics regarding symbols for the given market.
|


