How to access
| • | Select Broker Statistics from the main menu, select the Market from the list, click OK and go to the first tab "All Brokers" |
| • | Right-click on any equity symbol, go to Other > Broker statistics. If this menu option is not available, then broker statistics are not supported for that market. |
Description
Broker statistics show accumulated data for all the brokers active on one specific market. Double click on one of the brokers to drill down into symbols that the current broker has placed orders in on the market.
Change to Single broker or single symbol by using the drop-down on the top left of the broker statistics toolbar.
Table view
In the table view, each broker is represented with number of trades executed, turnover and more.
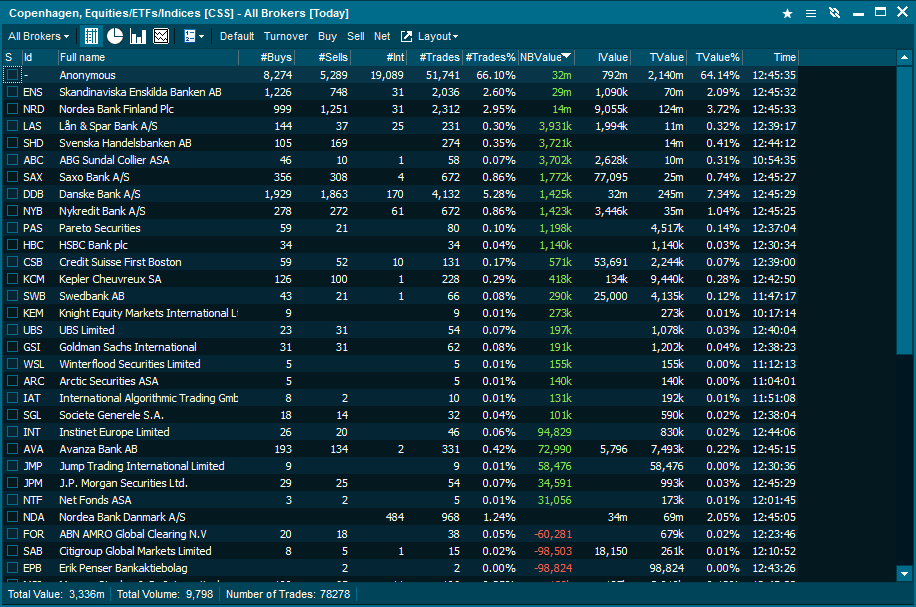
Available columns
| • | S (Checkbox for Timeline Selected) |
| • | Full name (The brokers name) |
| • | Time (time of last trade/update) |
| • | #Buys (Number of Buy Trades) |
| • | #Sells (Number of Sells Trades) |
| • | #Int Trades (Number Internal Trades) |
| • | #Trades (Total number of Trades |
| • | #Trades % (Trades shown in percent of total trades) |
| • | NB Value (Net Buy Value) |
| • | TValue% (Turnover Value in percentage)
|
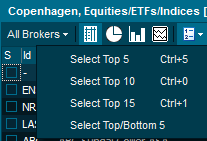
Select criteria to drill down
Use the "show" drop-down to select a range of brokers you want to see visually, or tick the checkboxes to the left of the broker codes.
Pie - Totals
The pie chart provides a visual representation of all broker statistics data.
Timeline - Selected
The Timeline enables you to select different brokers and view more details regarding changes. In the example below, an intraday timeline of net buy value with the top and bottom 5 brokers is shown.
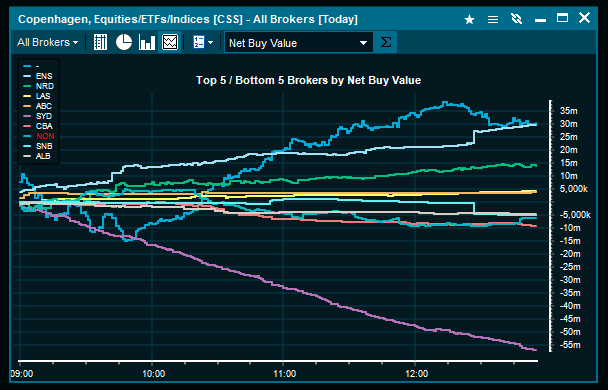
|


