How to access
| • | Select Broker Statistics from the main menu, select the Market from the list, click OK and go to the first tab "Single Symbol". Choose a symbol from the drop-down list. |
| • | Right-click on any equity symbol, go to Other > Broker statistics. If this menu option is not available, then broker statistics are not supported for that market. |
Description
This view displays accumulated data on all brokers active for the selected symbol. This enables you to get fast access to the brokers that are the largest buyers, sellers. most active etc.
Available columns
| • | S (Checkbox for Timeline Selected) |
| • | Full name (The brokers name) |
| • | Time (time of last trade/update) |
| • | #Buys (Number of Buy Trades) |
| • | #Sells (Number of Sells Trades) |
| • | #Int Trades (Number Internal Trades) |
| • | #Trades (Total number of Trades |
| • | #Trades % (Trades shown in percent of total trades) |
| • | NB Value (Net Buy Value) |
| • | TValue% (Turnover Value in percentage) |
Changing Symbol code
In the Symbols page you can switch to another symbol on the same market by just starting to type the symbol code.
Pie - Totals
The pie chart provides data on the selected criteria visually.
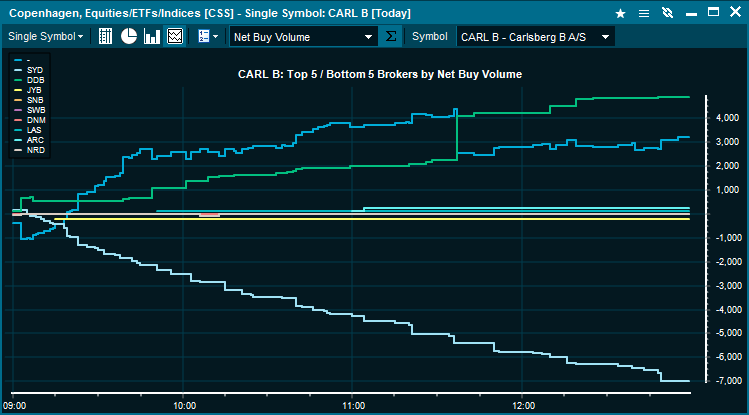
Timeline - Selected
The Timeline view enables you to select different statistics to view and change the symbol for the given market. Below are the Top/bottom 5 brokers Net Buy Volume for Carlsberg B A/S
|


