What's New in 6.1


What's New in 6.1 |
|
|
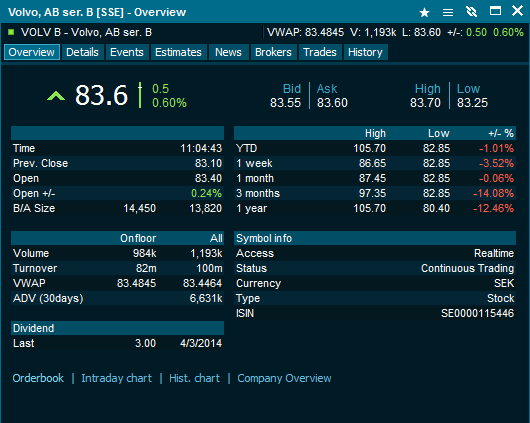
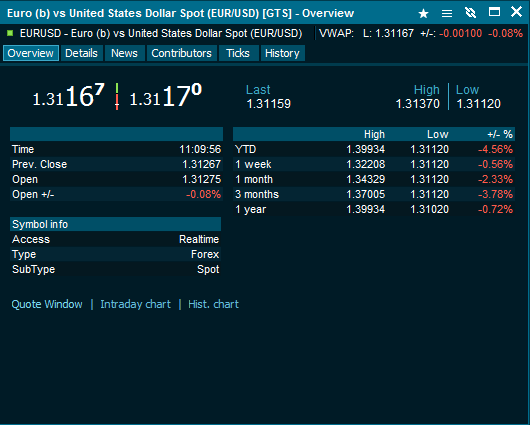
Symbol Overview Window Symbol overview window has been updated to give a better symbol overview by displaying key information in a structured way. Performance, pricing, volume and dividends are just a few of key values user sees on the symbol overview window. Direct access to orderbook, single or consolidated, company overview and charting makes further analysis easy accesible. The new symbol overview informs the user about the trading status and adjusts the displayed information based on the type of instrument. Stock symbol FX symbol
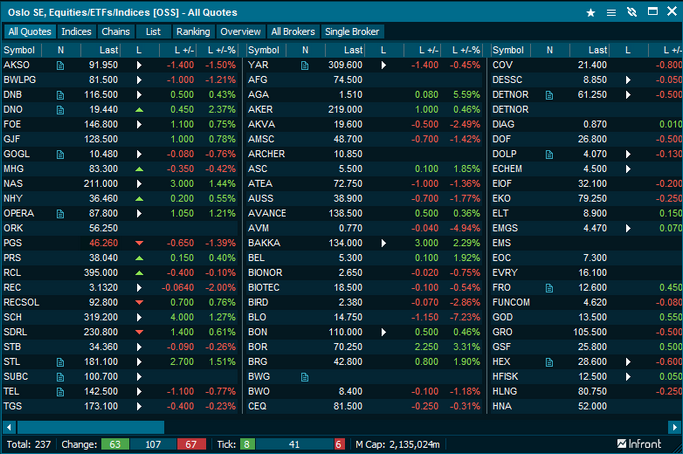
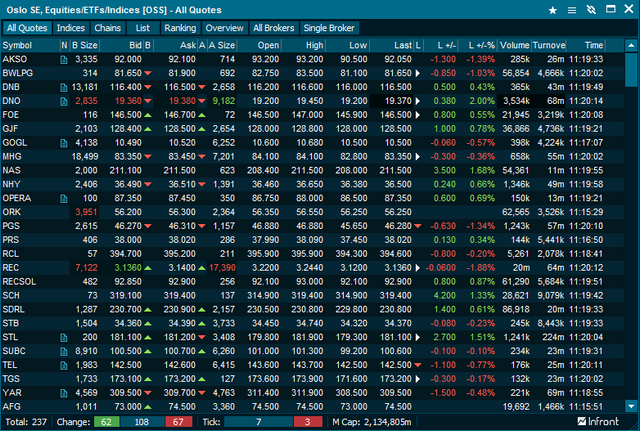
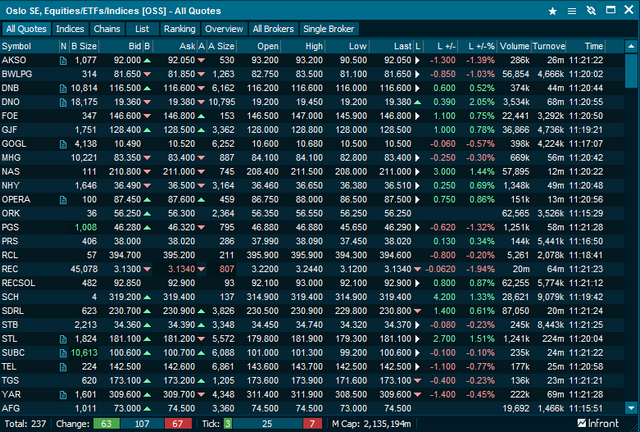
Side-by-side market window view Get the full overview and show more data on the screen with the new Side-by-side View. In any market window or Custom List, click on the window menu (top right corner) and select Side-by-side View.
High-contrast colors High-contrast setting raises the color contrast in the terminal. The setting is available in the Preferences-> User Interface -> General. Default terminal colors
High-contrast colors
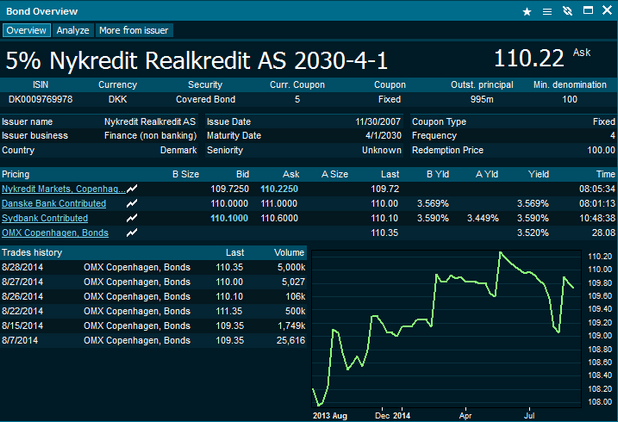
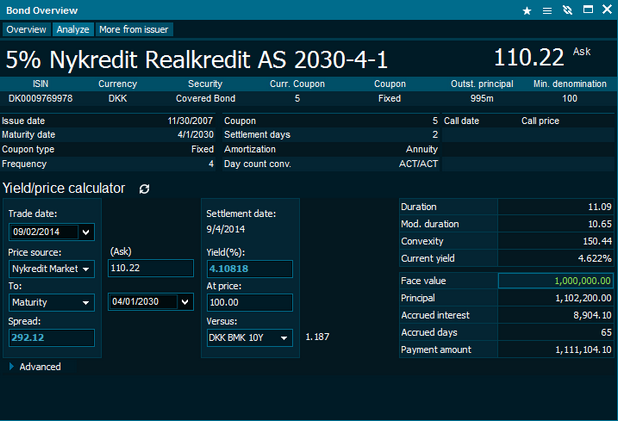
Corporate debt module Corporate Debt module has a special focus on pricing and fundamental data for listed and OTC debt in the Nordic and biggest European debt markets. The module is targeting buy and sell-side market participants looking for an effective, venue/contributor overview, possibility to calculate yield or price a bond on a given yield as well as calculate several important risk indicators. A powerful debt screening functionality allows the user to search by several important factors such as type, security, issuer industry and yield in addition to a free-text search which ensures the user will find what he is looking for every time. Unique Bond overview pages consolidate data for the instrument and display it in a way that provides the user with critical information in a timely and effective way. Bond overview covers reference data, market and indicative prices and an overview of the other issues from the same issuer. From here, user can navigate further to each and every venue the bond is traded on, issuer fundamentals or proceed with analytics. Yield calculator calculates yield from price and price from yield until Maturity, Next call, Worst as well as a Custom date. The calculated yield is compared to a benchmark for spreadanalysis. Last but not least, user can calculate the payment amount for a transaction taking into account principal and accrued interest.
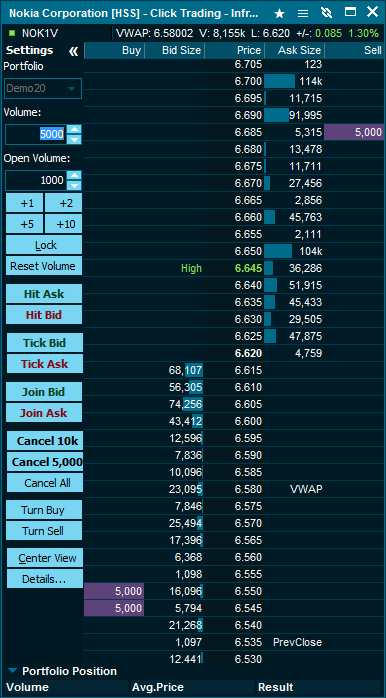
Click Trading Infront 6.1 brings improvement to the click trading functionality. A field for open volume has been added to the click trading window for better control over iceberg orders in the click trading window. The open volume stay until changed or the window has been closed down or instrument has been changed. The volume buttons are now accumulating the order volume. Pressing once on a pre-set volume button will add that volume to the total order volume. By holding down Ctrl the accumulate feature of the volume buttons is inactivated and the order volume will be replaced with the volume which the selected volume button had. In addition, a Reset Volume button has been added which resets both the order volume & the open volume. Lastly a feature for Turning orders has been added. This lets the user to immediately turn all buy or sell orders. Meaning it will delete all existing sell order for example and insert new buy orders with the same limit price.
|