|
Description
SME Direkt Level 2 provides a deeper level of fundamental data on Nordic companies with results, estimates and recommendations. It contains several years of historical results and future estimates in both yearly and quarterly resolutions. It allows drill-down into statistical details per company and visual presentation of historical trends.
Data content included per company the in SME Direkt Level 2 package:
| • | EPS (Earnings per share) |
| • | DPS (Dividends per share) |
| • | A number of years and quarters of reported results |
| • | A number of years and quarters of estimated numbers (consensus) |
| • | Historical changes of estimates, shown graphically |
| • | Statistical values for each variable |
| • | Growth Period (Quarterly) |
Requirements
| • | Subscription to an SME Direkt Level 2 package |
How to access
| • | File | New | SME Direkt Consensus Estimates |
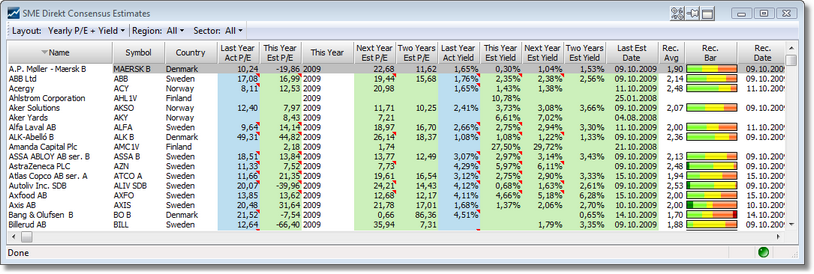
SME Direkt Consensus Estimates window
This window displays a list of all available companies and entities that SME Direkt support consensus estimates and results for. It allows you to choose between different layouts, to filter out specific regions or sectors and to sort on any column. You can copy RTD links to get the data into Excel.
Layouts
All the layouts include columns for company name, symbol ticker code, country, last estimation date, recommendation average, recommendation bar and recommendation date.
The following layouts are supported:
| • | Yearly P/E + Yield (default)
This layout shows yearly actual and estimated values for P/E and Yield. |
| • | Yearly Prextax + Sales
This layout shows yearly actual and estimated values for Pretax and Sales. |
| • | Yearly Prextax Estimates Change
This layout shows yearly estimated values for Pretax and how much the estimates have changed in the last update. |
| • | Yearly Sales Estimates Change
This layout shows yearly estimated values for Sales and how much the estimates have changed in the last update. |
| • | Quarterly
This layout includes columns for the current quarter of each company. It includes values for Estimated Sales, Actual Sales, Estimated Pretax avg, low and high, Actual Pretax, Last Years Actual Pretax for the same quarter and Actual Pretax deviation (the percentage deviation between the quarter's estimated pretax and the actual reported pretax values). |
Notes
Some of the numbers may have a note associated with them. There is a small red rectangle in the top right corner of the cell to indicate this. Hoover the mouse over the cell to see a hint with the note text.
Recommendation Bar
The Recommendation Bar column shows a graphical representation of the recommendations from the analysts. It shows up to 5 different level of recommendations: Strong buy, Buy, Hold, Sell and Strong Sell. Each level is color-coded with shades of green for buy, yellow for hold and shades of orange and red for sell. The width of each color in the bar is relative to the total number of recommendations.
Recommendation Average
The Recommendation Average column is a weighted average of all the recommendations.The average recommendation value range is from 0 (Strong sell), via 2 (a neutral Hold) to 4 (Strong Buy). It is possible to sort on this column to rank the companies according to how they are recommended.
Sorting
You can sort on column simply by double-clicking on the column header. Double-click again to sort in reverse order. When changing layouts the sorting is reset to the default (by name).
Filtering by Region and Sector
Use the Region and Sector drop-down to filter the list by Region (for instance Sweden) and/or Sector (for instance Information technology).
Type-to-search
Just like a market window, this window supports searching for companies just by typing. Start typing to search by symbol ticker. Hold down the Shift key and start typing to search by description.
Miscellaneous
This window implements support for highlighting the selected row. This is controlled by the same setting as used by the Market windows, Tools | User Interface | Grids | Indicate selected row.
Copy contents as text by selecting the range of cells you want and pressing Ctrl+C (or select Edit | Copy).
Copy contents as Excel RTD links by by selecting the range of cells you want and pressing Ctrl+R (or select Edit | Copy RTD Link).
|


