Return Histogram


Return Histogram |
|
|
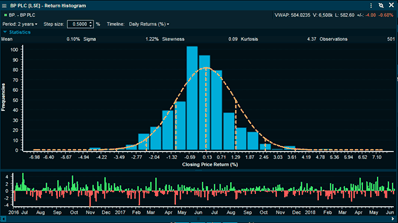
. This window displays the empirical distribution of the daily returns for a particular instrument or portfolio.
PeriodTime series length. Options: All, last year to date (LYTD), year to date (YTD), and 1 to 5 years. The user can also customize the length of the series selection ‘Custom’. TimelineAllows the user to select the overview of the series in the lower panel. ‘Daily returns’ displays the log returns in a bar chart, and ‘History’ the actual values of the series. Statistics barOn the top of the histogram it is displayed the moments of the empirical distribution. Mean: Log daily returns Sigma: Standard deviation from the log return series Skewness: Standardized skewness of the empirical distribution as in Pearson’s moment coefficient of skewness. Kurtosis: Excess kurtosis of the empirical distribution
|