How to open
Select multiple instruments in a market window or a watchlist > Rightclick > Charts & Visualizations > Correlation Matrix.
Description
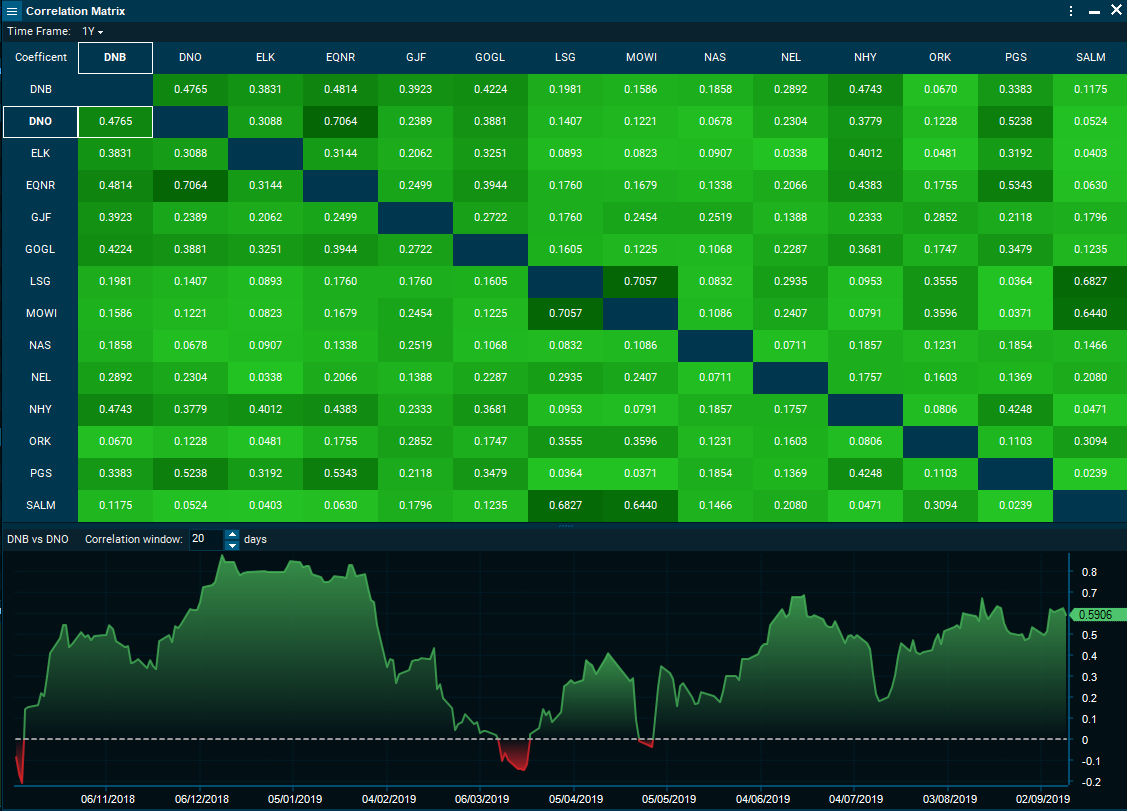
The Correlation Matrix window displays the cross correlation among multiple instruments.
•Time Frame: Time series length. Options: All, last year to date (LYTD), year to date (YTD), and 1 to 5 years.
•Matrix: Displays the cross-correlation across instruments as in “Pearson Correlation Coefficient”. The coefficient displayed in the Matrix corresponds to the entire sample given the Time Frame selected in the window caption.
•Coefficient: Each coefficient on the Matrix can be selected. A single click will display a rolling coefficient, while a double click will display a comparison chart for the selected timeframe.
•Rolling correlation: When a coefficient is selected, i.e. Rho(Instrument A, Instrument B), a chart with a rolling coefficient will appear in the lower panel. The user can modify the size of the rolling window changing the number of “Correlation window”.