This version includes a number of requested features and fixes.
SME Level 2
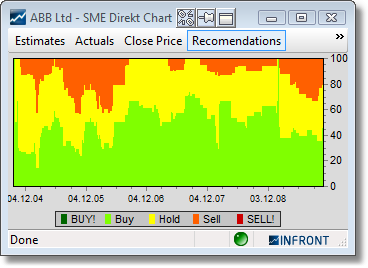
In the SME Chart window we have expanded the Start from drop down to include 2 years and 4 years back.
If only Recommendations are included in the chart, it will now fill the height of the window.
Charts
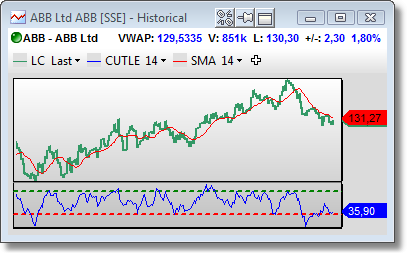
New study Cutlers RSI (CUTLE)
Where Wilder's RSI is calculated by determining the difference between the open and the close, Cutler's RSI is calculated by determining the difference between the previous bar's close and the current close (the net change). Cutler's RSI is not data length dependent, and returns consistent results regardless of the length of, or the starting point within a data series.
New study Simple Moving Average (SMA)
SMA is the unweighted mean of the previous n data points. For example, a 10-day simple moving average of closing price is the mean of the previous 10 days' closing prices. In technical analysis there are various popular values for n days, like 10 days, 40 days, or 200 days. The period selected depends on the kind of movement one is concentrating on, such as short, intermediate, or long term. In any case moving average levels are interpreted as support in a rising market, or resistance in a falling market.
Remove axis labels
Labels on the X and the Y axis can now be removed.
Bar and Yield Chart
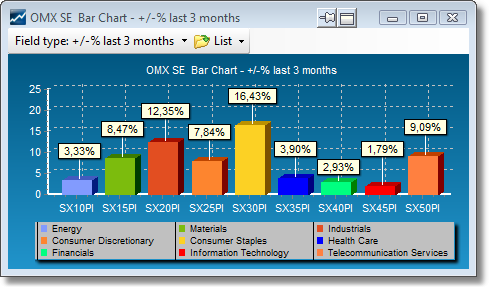
Link from Bar chart on indices to and Index Constituents
If you double-click on a index bar in a bar chart, a new Index Constituents window will open, sorted on the field you charted.
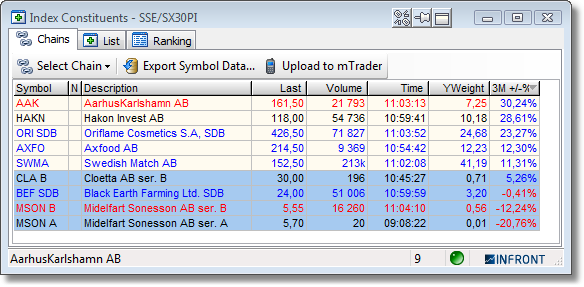
For instance, double-clicking on the yellow SX30PI (Consumer Staples) in this +/-% 3 months bar chart...
...opens a window showing all the Index Constituent for that index, sorted by +/-% 3 months:
Copy and printing
The Bar chart and Yield chart now support copying the chart as a bitmap and printing.
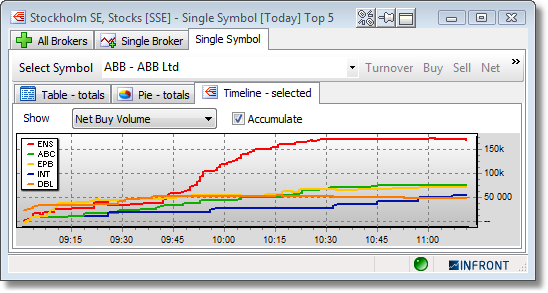
Broker statistics
Dynamic timeline chart
The top brokers in the timeline charts are now dynamically updated as the ranking changes.
Improved colors
The coloring of chart series in the timeline chart has been improved. Now the top 16 items use a fixed set of high-contrast colors.
Layout buttons
There are now four new layout buttons in the grid views (Turnover, Buy, Sell, Net).
Fonts and Colors
The configuration of fonts and colors has been extended to cover the chart axis, frame and headline.
Symbol window
New estimates tab
SME and FactSet data has now been moved to a new estimates tab. Note, this tab is only visible for stocks for users who subscribe to FactSet and / or SME services.
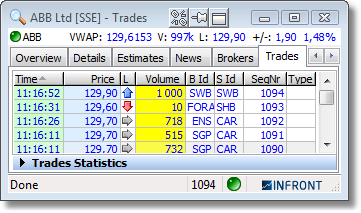
Trades tab
Individual background colors can now be assigned to each column.
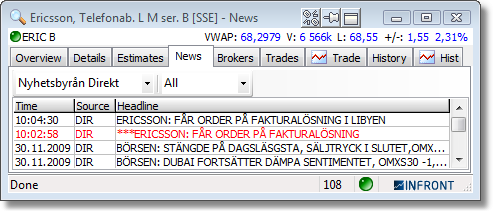
News tab
News items can now be filtered by news source.
The period setting now correctly filters out news items outside the selected range.
There is also a new period selector for all news items providing smooth download of news items as the user scrolls down the list.
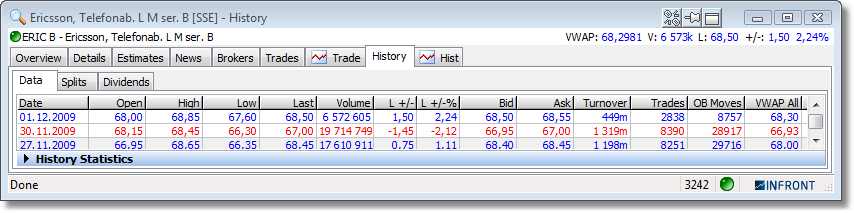
History tab
By default, now all columns are included in the History list. Just scroll or resize the window to see the additional columns.
Market window
When multiple symbols are selected, there is a new right click popup menu providing the following actions for the selected symbols:
| • | Composite: opens a composite window with the selected symbols. |
| • | Intraday compare charts: The compare chart window is opened as a relative, indexed or rebased chart with the selected symbols. |
News window
The automatic splitter can now be enabled / disabled by right clicking in the window and selecting Enable splitter from the popup menu.
The filter dialog is now resizable and remembers the size and advanced mode settings. There is now a Cancel button to close it without making any changes.
All commands on the toolbar are now also available in the right-click menu. This is convenient when maximizing screen usage by turning off the toolbar (by pressing F11).
Order Entry
In the Trades list, there is now a new, optional column called Remaining. This shows the Remaining volume of the order that the trade was triggered from. This may be useful when exporting the list of trades to an external system for analysis.
Order Limits now supports At Market orders (by using the current market price as the estimated order price).
The Accumulated Trades page now supports a new column called Unrealized Result.
When viewing an order or trade on a derivative, additional details about the symbol is included; symbol type, sub-type and maturity date (it already included underlying, strike and expiry date).
News Contribution
The News Contribution window now supports pasting formatted text including tables in HTML format - for instance from Word or Excel. This makes it easier to create good looking news stories. The news stories are displayed in an internal window in the client, rendering the HTML code into a good loking news story (note this requires that the end users have version 4.6 or later).
|


