SME Direkt Level 2 Consensus Estimates
Version 4.7 supports more detailed consensus estimates and results from SME Direkt. This requires that you have access to a SME Direkt Level 2 package.
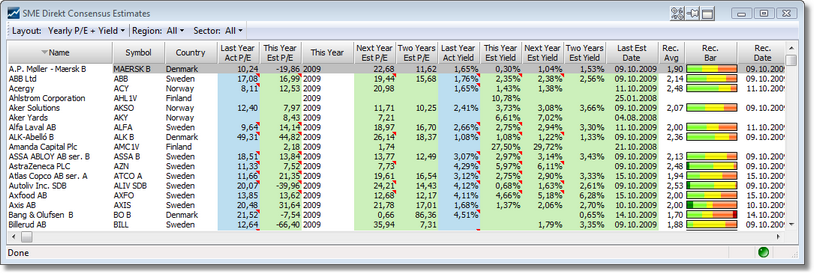
SME Direkt Consensus Estimates
This window displays a list of all available companies and entities that SME Direkt support consensus estimates and results for. It allows you to choose between different layouts, to filter out specific regions or sectors and to sort on any column. You can copy RTD links to get the data into Excel.
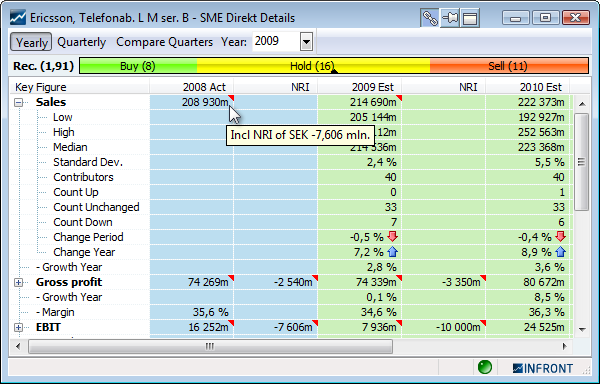
SME Direkt Details
Double-click in the list to drill down and open a Details window for the selected company. Here you can also select different layouts and override the default focus year. The default shows average key ratios, growth and margins. You can also expand key ratio nodes to see statistical values such as Low, High, Median and number of Contributors. Copying of RTD links is supported.
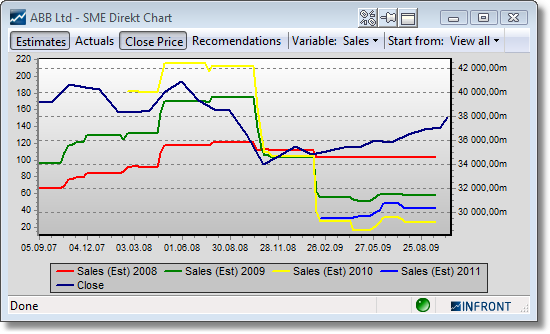
SME Direkt Chart
Right-click and select SME Direkt Chart to get a historical chart of estimate changes for specific key ratio variables. You can even plot actual results, recommendation history and the company's close price.
SME Direkt RTD Links
All the new SME Direkt Consensus Estimates data can be linked directly into Excel by using RTD links. You can enter RTD links manually in Excel or copy them from the SME Direkt Consensus Estimates and SME Details windows.
Orderbook improvements
Indicate my orders
In addition to the indication of the price level your order belongs to, the orderbook is now able to indicate where in the queue of a price level your order exists. As orders in front of you executes and as new orders are added behind you, you will see your order progressing in the queue until it is at the front and next to be matched and executed.
The color used to indicate your order's queue position is configurable, the default is lime green.
More logical blinking and updates of the orderbook
In earlier versions, when there were newly inserted or deleted levels in the orderbook, all the levels below would blink violently in red and green. This was quite confusing and noisy and it was hard to see exactly what was going on.
We have now added logic to ensure that only the line of the inserted order level (or the level below one that was just deleted) blinks in a separate color. This makes it much easier to see that a new level has been inserted or a level has been deleted.
By default the color to indicate insertions is Sky Blue and the color to indicate deletions is Medium Gray, but as usual these can be configured in the color Setup dialog.
Support for multiple orderbook kinds
This version supports three kinds of orderbooks; MBL, MBO and MBL from MBO.
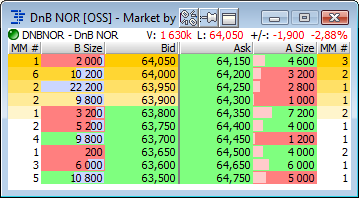
Market by Level (MBL) Orderbook
The Market by Level orderbook is the kind of orderbook that older version have always supported (used the be called Accumulated Orderbook). In this kind of orderbook all the public orders on a symbol from a specific exchange are accumulated into unique price levels. So if there are three orders at 100 SEK, with volumes 1000, 2000 and 3000, there will be only one level in the orderbook at 100 SEK and with a total volume of 6000.
Technically, this orderbook is distributed from the servers level-by-level. This means that the client application cannot "see" the detailed orders that each level contains - it can only see the total volume (and sometimes the number of orders). In this kind of orderbook the application is able to mark the price level that matches the price of your active order (yellow above).
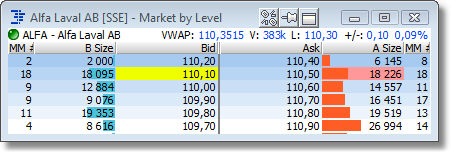
Market by Order (MBO) Orderbook
The Market by Order orderbook does contain all the detailed, single orders that investors have in the public orderbook. An MBO orderbook may contain a large number of orders with exactly the same price. Each order will get a separate line in the orderbook. So you get much more detailed information about the public orders in the market.
The application is still able to mark the price of all the orders that match your active order (yellow). In addition, if the order management server (OMS) supports it, and the public order-id and your active order's exchange order id matches, the application is even able to indicate exactly what public order in the orderbook that represents your active order (green). The combination of these two color indications will give you a visual clue to where in the order queue your order is at any point in time.
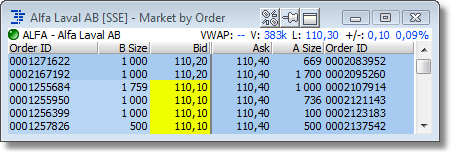
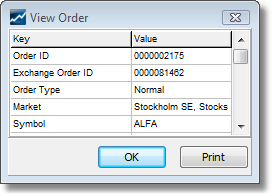
Notice that the MBO orderbook supports showing the public order IDs. Our order has an ID of 000081462. The same exchange order ID can be seen in the View Order display in the order entry module:
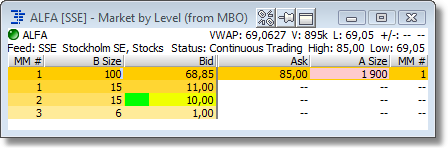
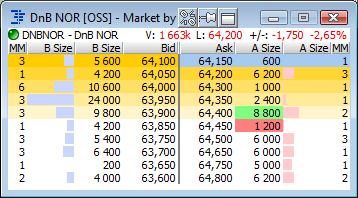
Market By Level from MBO Orderbooks
Sometimes the MBO orderbooks may contains just too much information to be useful or digestible. So we have created a new kind of orderbook that takes the detailed MBO orderbook received from the server and transforms it into an accumulated MBL orderbook locally in the client by aggregating all the orders that have the same price into one level. The advantage is that we still have the detailed MBO information available and thus we can still show where your single order (green) is in the level's queue (yellow).
On a technical level, distributing only changes, deletion and inserts of single orders can be more efficient than updating all the levels in an MBL orderbook. We are also able to customize the number of MBL levels available to the user and so on - an MBL from MBO orderbook may be available to the user, even if the user is not eligible to see the full MBO orderbook itself.
Volume Bar in separate columns
There is now an option in the orderbook setup that will display the Volume Bar in separate columns (instead of default of displaying them in the same column as the Bid and Ask Size column).
Charting module improvements
There are a number of new features and improvements in the charting module.
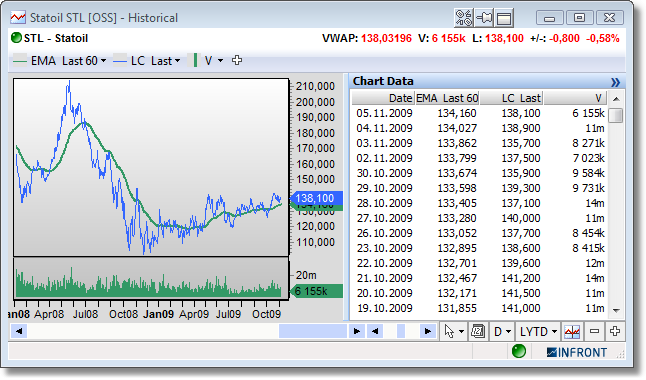
Chart data
New data grid which shows all chart series data. When using the chart cursor, the current value will be focused in the grid. It is possible to copy all content in the grid.
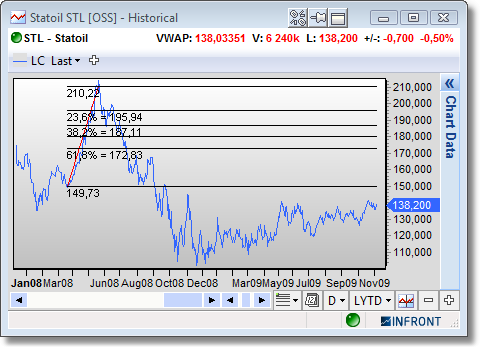
Fibonacci retracement
A term used in technical analysis that refers to the likelihood that a financial asset's price will retrace a large portion of an original move and find support or resistance at the key Fibonacci levels before it continues in the original direction. These levels are created by drawing a trendline between two extreme points and then dividing the vertical distance by the key Fibonacci ratios of 23.6%, 38.2%, 50%, 61.8% and 100%.
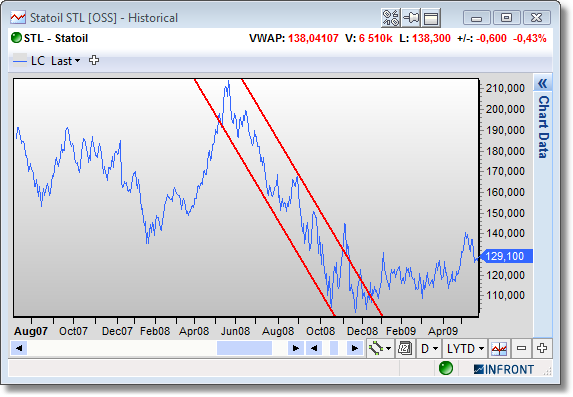
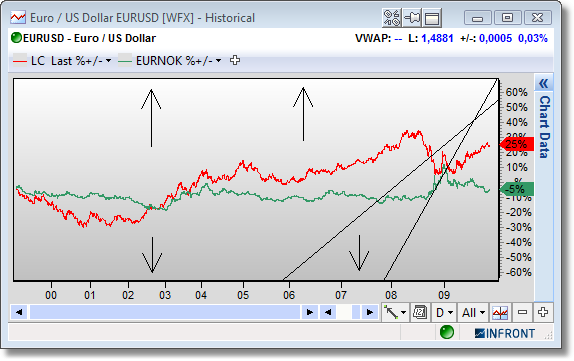
Parallel lines
In addition to the two existing channels trend lines, horizontal and vertical parallel lines, it is now a third option to add parallel lines. These two lines will follow each other in any direction on the chart.
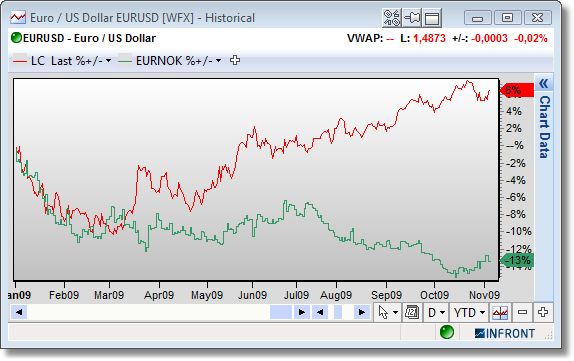
Compare study %+/-
New compare study which will compare two or more price lines in percent within given time period.
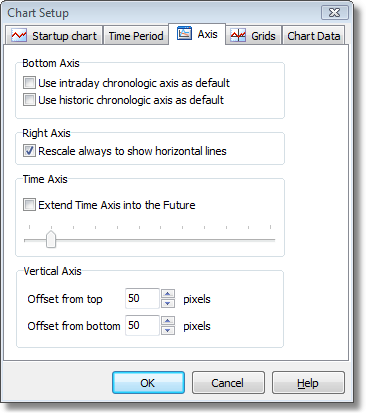
Vertical chart axis offset
From chart setup, under the Axis page, it is possible to set a top and bottom offset in pixels.
Market window improvements
Peer groups
When right clicking on a symbol, a new menu option “Peer Groups” will be displayed if the selected symbol has a GICS code. This menu choice will make a new composite list containing all symbols with the same level 1 GICS code.
All +/- columns colored up/down
In the Market and Composite windows, the color of the text and numbers indicate if the symbol is up or down today. This convention has been extended so that all +/- and +/-% columns now show colors indicating positive or negative values for that column.
Put/Call command extended
The right-click command Put/Call can be used to go from an underlying symbol to the Put/Call page of the corresponding derivatives feed, showing all the Put and Call options for that underlying.
This feature has been extended so that you can now jump from options and futures as well (by using the derivative's underlying as target). You can also double-click on the Expire date cell to jump from an option or future to the Put/Call page.
New Quotes page for open derivatives feeds
Open derivatives feeds (such as Eurex Options, EXO) now have a new page in the Market window called Quotes. In this page you can select and underlying and filters for Expiry dates derivatives types and activity.
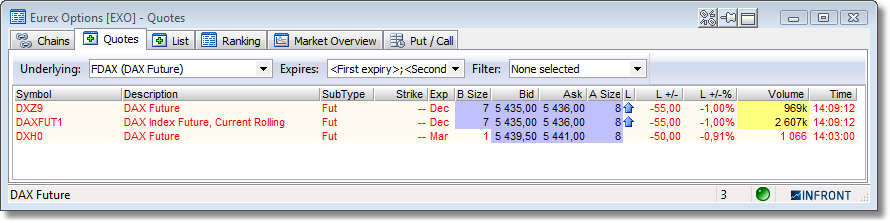
The same filtering is mirrored in the Put/Call page. You can now also jump directly from an derivative symbol to the quotes page with the correct underlying selected by double-clicking on the subtype cell of the symbol (for instance in the Chains page).
New user interface option "Auto save quote list per feed"
A new user interface option is introduced to give more control over loading and saving quote lists. Select User interface on the tools menu and set the desired setting for the Auto save quote list per feed option on the General tab.
When this option is checked (the default setting), all symbols added to the list tab are automatically saved for the feed when the application closes.
When the option is unchecked, the user has more options to manage quote lists. On the tool bar, there are two new buttons:
On the right click menu there is a new list section with the following actions:
| • | Save list as default for feed |
Note: saved quote lists may include symbols from several feeds.
|


