Broker Statistics - Single Broker


|
Broker Statistics - Single Broker |
|
|
Description Broker statistics for a Single Broker provides you with accumulated data for one selected broker for the selected period either intraday or historical. The information is displayed as columns, pie chart or line charts. How to access
Table - Totals The Table provides you with different information updated in realtime. Available columns
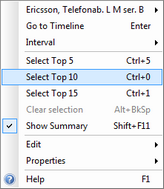
Edit columns It is possible to edit columns by right clicking on a column and Select columns. Sorting It is possible to sort on each column by double clicking on the column header. Caption on/off When you turn off Properties | Show Extra Information (F11) the tabs and optional controls are hidden, minimizing screen estate usage. In the Timeline chart, the available detail fields (Volume, Buy Volume etc) are now also available from the right-click menu, Timeline Field. In the Broker Stats window, the broker name is now shown in a hint message when resting the mouse on timeline chart line (see above). You can now go directly between the Table - totals and the Timeline - selected pages by using the keyboard shortcuts Enter and Backspace. The selected sorting column in each of the Broker Stats grids is also saved in the workspace. Pie - Totals The pie chart provides data on the selected criteria graphically. Select different data input from the "Show" drop-down menu; Timeline - Selected The Timeline view enables you to select different brokers from the Table tab and view more in details the information for the defined brokers.
|