Broker Statistics - All Brokers


|
Broker Statistics - All Brokers |
|
|
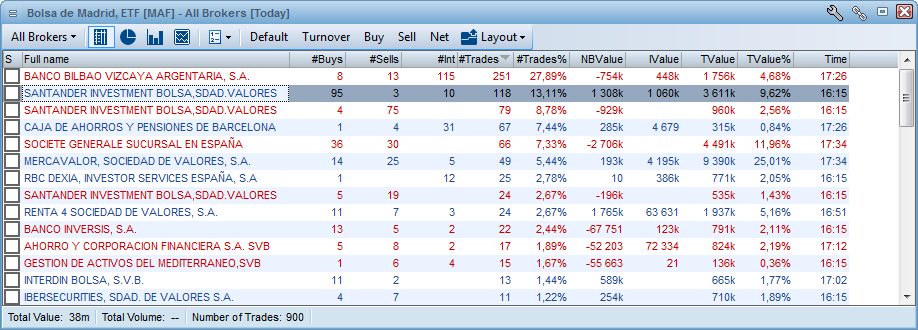
Description This view shows accumulated data for all the brokers active on one specific market. By double clicking on one of the brokers, you are moved to the Single Broker folder for accumulated data for a specific brokerage. How to access
Table In the table view, each broker is represented with number of trades executed, turnover and more.
Available columns
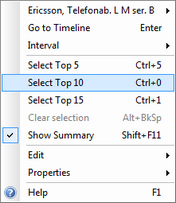
Edit columns It is possible to edit columns by right click and choose Select columns. Sorting It is possible to sort on each column by double clicking on the column header. Pie - Totals The pie chart provides data on the selected criteria graphically. Select different data input from the "Show" drop-down menu; Timeline - Selected The Timeline view enables you to select different brokers from the Table tab and view more in details the information for the defined brokers. Right click in the Table view to select e.g the Top 10 brokers by turnover; |