Market Window


Market Window |
|
|
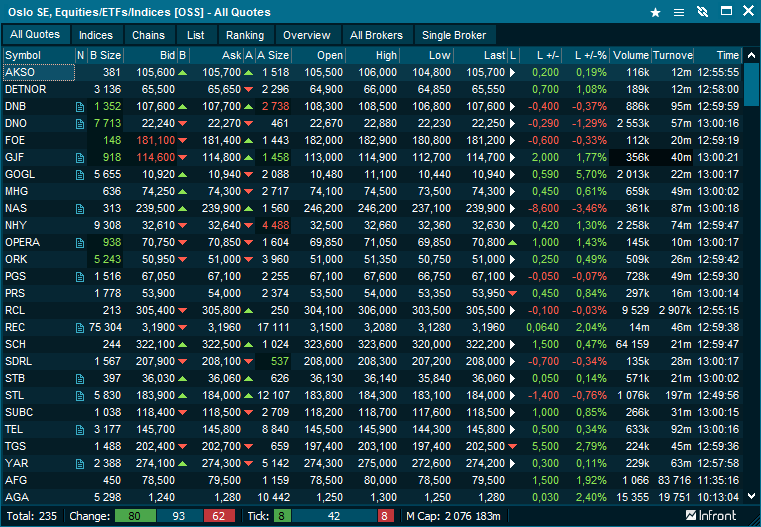
Description The Market Window is the main window for streaming quotes in addition to the Composite Window and Market Pages. The Market Window can display different types of symbols (such as equities/stocks, options, warrants, futures, forex and fixed income data). The symbols in the Market Window are either displayed as pre-defined lists (for small and medium markets) or as one and one based feeds for larger markets. How to open To open a market window click Market from the Main menu. The Select Market dialog displays a list of all the markets you are subscribing to. Select the desired market and click OK.
The market window displays a number of tabs depending on which market you are looking at. The following is a short description of each tab. All QuotesThe All Quotes tab is available for markets where there is a pre-defined list of symbols. All information is updated continuously and changes are highlighted with different colors. To define your own colors, right-click in the Market Window and select Properties | Edit colors. Symbol informationTo view more details about a symbol right-click and get the Symbol menu Keyboard searchTo change the symbol type in the symbol code on your keyboard and press enter. The symbol will be displayed on the top of the Market window. Select ColumnsWhich columns you want to display is easy to change. Right-click on a column and click Select Columns. Sorting ColumnsThe columns can be sorted by double-clicking on any column. The list will automatically stay sorted, even when the underlying values change in real-time. IndicesThe indices tab has the same features as the All Quotes tab but this tab displays only the indices for the selected market. This is optional and can be turned off in Tools | User Interface. ChainsThe chains tab has the same features as the All Quotes tab but this tab displays pre-defined lists from the server that can combine symbols or just be a sub section of All Quote. Read more. ListThe list tab has the same features as the All Quotes tab but this folder displays only the symbols you have manually added. This is done by right-clicking on a symbol and selecting Edit | Add to List. Note that the List also can be changed by:
Setting how quote lists are savedBy default all symbols added to the list tab are automatically saved for the feed when the application closes. You can get more control over saving and loading quote lists by disabling the default behaviour: On the tool bar, there are two new buttons:
On the right click menu there is a new list section with the following actions:
Tip: saved quote lists may include symbols from several feeds. RankingThe Raking tab displays today's winners, losers and highest turnover. By default, the content of the ranking is based on the list found in the all quotes tab. It is possible to change the content by selecting another list from the source drop down menu in the ranking toolbar. Based on available content, the possible selections are all quotes, indices, chains and list. For chains and list, it will rank the content for what is currently selected in the respective tabs. ColumnsWinners and losers ranking will by default have the following columns:
It is possible to change the winners and losers column content by right click on the column header and select Select Columns. Please notice that any change to the winners columns will also be updated in the losers columns and vice versa.
The turnover ranking will by default have the following columns:
The column selection for turnover ranking is separate from the winners and losers ranking columns, but work in the same way. Right click on the turnover ranking column header in order to change the visible columns.
Use the splitter between the losers grid and the turnover grid in order to resize the width of all the grids. Notice that winners and losers grid will automatically be adjusted to the same size, as the columns will always be the same. Market OverviewThe Market Overview tab provides a graphic view of the selected market, the main market index, percent of shares traded (calculated on Market Capitalization), Number of symbols up/down and turnover up/down today. All BrokersThe All Brokers tab displays today’s active brokers for the selected market with detailed information. Read more about Broker Statistics. Single BrokerThe Single Broker tab displays accumulated information about the selected broker. Read more about Broker Statistics. Put / CallThe Put / Call tab displays and sorts options and warrants data. Read more about the Put/Call folder. Drag-and-dropIn earlier versions of the program you could drag-and-drop a single symbol between windows and lists. This has now been extended so that you can select a block of symbols and drag-and-drop them on a list. You can drop a list of symbols on the List page of a Market or Composite window or on a Basket Trading window (to automatically create basket orders for each dropped symbol). |