|
Description
FactSet provides fundamental data on international companies with results, estimates and recommendations.
Data content included per company the in FactSet package:
| • | EPS (Earnings per share) |
| • | DPS (Dividends per share), |
| • | CFPS (Cash-flow per share) |
| • | P/CF (Price / Cash-flow) |
| • | Last year’s reported result |
| • | Next year’s estimated numbers (median) |
Requirements
| • | Subscription to a FactSet package |
How to access
| • | In an FactSet Consensus Estimates section the Details page of the Symbol Window |
| • | As columns in the Market and Composite windows |
FactSet Consensus Estimates section
The FactSet Consensus Estimates is included as a section in the Details page of the Symbol Window.
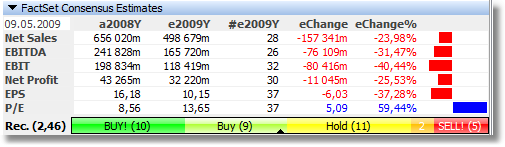
Each line in the grid shows last year’s result (or actual), next year’s estimated, number of contributors, nominal change and percentage change for each of the available key figures. The last column shows the percentage change graphically. This gives a quick overview of the expected changes in the coming year.
The date in the upper left corner of the grid shows the date the estimates was last updated. Note that all key figures may not be available (or applicable) to all companies.
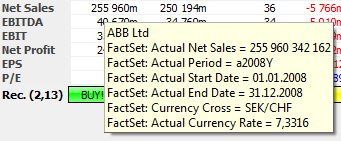
Currency conversions
For some results and estimates, the currency of the original values differ from the stock's trading currency. In these cases, the application will convert the values back to the trading currency, using historical currency rates (from the fiscal year end or estimated date). The currency crosses and rates used are then displayed above the other key figures.
The currency cross values used are the closing value from a historical date. For actual results, the date is the end of fiscal year date (say December 31st 2008). For estimated values, the date is the date of the estimation update (say June 12th 2009).
Recommendation bar
At the bottom of the section is a graphical representation of the recommendations from the analysts. It shows up to 5 different level of recommendations: Strong buy, Buy, Hold, Sell and Strong Sell. Each level is color-coded with shades of green for buy, yellow for hold and shades of orange and red for sell.
The number of votes in each category is shown and the width of the color bar is relative to the total number of votes. The middle of the recommendation bar is indicated with a small black arrow and indicates the balance point or average recommendation value. The same value is shown numerically in the label to the left of the bar. The average recommendation value range is from 0 (Strong sell), via 2 (a neutral Hold) to 4 (Strong Buy).
Hover the mouse over the recommendation bar to see the date of the recommendations and full descriptions of all values.
Hints with more detailed information
If you hover the mouse over the value columns, additional information will be shown for that value.
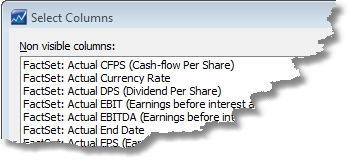
FactSet columns
All FactSet values displayed in the Symbol window are also available as columns in the Market or Composite windows. All these columns are prefixed with FactSet in the Select Columns dialog.
In the column captions the FactSet fields are prefixed with an "F" - this is to distinguish them from the corresponding SME Direkt Level 1 fundamental fields.
Double-clicking a fundamental column value will open the the Details page for that symbol.
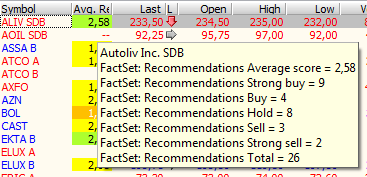
The background color of the Recommendation columns indicates what direction the value represents (strong buy, buy, hold, sell, strong sell).
You may want to consider using some of the Merged fundamental columns instead.
Extended Cell Hints
Some columns will show additional information in the cell hint. This way you have quick access to more detailed information without adding too many columns.
List of FactSet columns
The following is a sorted list of all available FactSet columns included in the package.
| • | Actual CFPS (Cash-flow Per Share) |
| • | Actual DPS (Dividend Per Share) |
| • | Actual EBIT (Earnings before interest and taxes) |
| • | Actual EBITDA (Earnings before interest, taxes, depreciation and amortization) |
| • | Actual CFPS (Cash-flow Per Share) |
| • | Actual DPS (Dividend Per Share) |
| • | Actual EBIT (Earnings before interest and taxes) |
| • | Actual EBITDA (Earnings before interest, taxes, depreciation and amortization) |
| • | Actual EPS (Earnings Per Share) |
| • | Actual P/CF (Price/Cash-Flow Ratio |
| • | Actual P/E (Price/Earnings Ratio) |
| • | Actual Yield% (100 * DPS / Last) |
| • | Change in CFPS (Cash-flow Per Share) |
| • | Change in DPS (Dividend Per Share) |
| • | Change in EBIT (Earnings before interest and taxes) |
| • | Change in EBITDA (Earnings before interest, taxes, depreciation and amortization) |
| • | Change in EPS (Earnings Per Share) |
| • | Change in P/CF (Price/Cash-Flow Ratio |
| • | Change in P/E (Price/Earnings Ratio) |
| • | Change in Yield% (100 * DPS / Last) |
| • | Estimated CFPS (Cash-flow Per Share) |
| • | Estimated DPS (Dividend Per Share) |
| • | Estimated EBIT (Earnings before interest and taxes) |
| • | Estimated EBITDA (Earnings before interest, taxes, depreciation and amortization) |
| • | Estimated EPS (Earnings Per Share) |
| • | Estimated P/CF (Price/Cash-Flow Ratio |
| • | Estimated P/E (Price/Earnings Ratio) |
| • | Estimated Yield% (100 * DPS / Last) |
| • | Number of Contributors Estimated CFPS (Cash-flow Per Share) |
| • | Number of Contributors Estimated DPS (Dividend Per Share) |
| • | Number of Contributors Estimated EBIT (Earnings before interest and taxes) |
| • | Number of Contributors Estimated EBITDA (Earnings before interest, taxes, depreciation and amortization) |
| • | Number of Contributors Estimated EPS (Earnings Per Share) |
| • | Number of Contributors Estimated Net Profit |
| • | Number of Contributors Estimated Net Sales |
| • | Percentage change in CFPS (Cash-flow Per Share) |
| • | Percentage change in DPS (Dividend Per Share) |
| • | Percentage change in EBIT (Earnings before interest and taxes) |
| • | Percentage change in EBITDA (Earnings before interest, taxes, depreciation and amortization) |
| • | Percentage change in EPS (Earnings Per Share) |
| • | Percentage change in Net Profit |
| • | Percentage change in Net Sales |
| • | Percentage change in P/CF (Price/Cash-Flow Ratio |
| • | Percentage change in P/E (Price/Earnings Ratio) |
| • | Percentage change in Yield% (100 * DPS / Last) |
| • | Recommendations Average score |
| • | Recommendations Strong buy |
| • | Recommendations Strong sell |
|


