What's New in 5.5 (Professional Plus)


What's New in 5.5 (Professional Plus) |
|
Infront Professional PlusThe Professional Plus edition of the Infront terminal meets the needs of advanced users who require a cost-effective alternative to expensive, over dimensioned market data solutions. Infront Professional Plus provides unique features not available in other terminal editions and is bundled with an extensive package of content and services. Infinancials Investor +Infront Enterprise Edition includes the Infinancials Investor + package, which provides advanced integration with Microsoft Excel. For more information, browse the Infinancials Learning Centre by clicking on the Infinancials button in the Infront terminal.
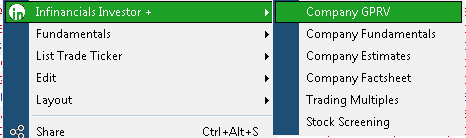
How to install the Infinancials Investor + Excel Add-InIn order to export Infinancials data to MS Excel, you will need to download and install the Infinancials Investor + Excel Add-In: 1. Open the Infinancials window by clicking the Infinancials button in the terminal 2. Click on Product Downloads on the Infinancials home page 3. Select “Investor Plus Excel Add-In” to download and install New Infinancials CommandsThe right-click menu for a stock has been extended with new commands that go directly to different analysis and information available in the Infinancials service.
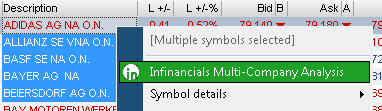
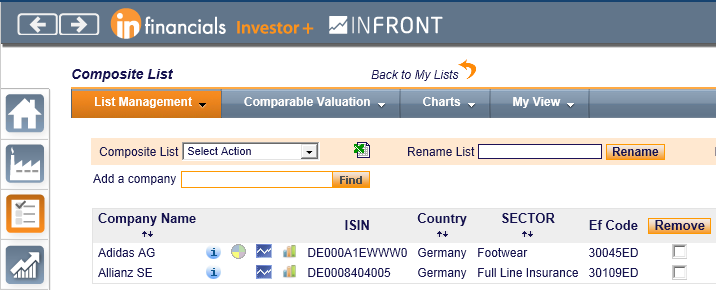
Infinancials Multi-Company Analysis
You can now select a range of stocks and import them into an Infinancials list that can be used for further multi-company analysis.
After the list has been exported to your Infinancials account, we open an Infinancials window with your list - ready to be analysed. Note: If you want to keep the list for later, you should rename it in the Infinancials page – use the Rename button.
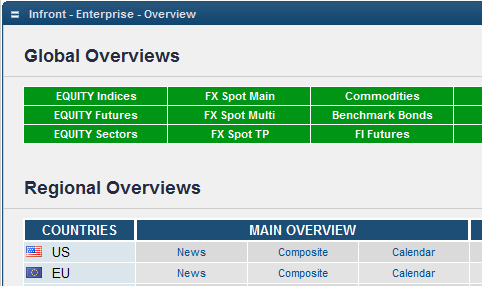
A new button named “Go” has been added to the terminal toolbar. Press this button to open the Plus Overview Page: a starting point for accessing all Global and Regional market data available in Infront Professional Plus. From the Overview Page, you can drill down into further Market Pages or other windows containing detailed market data.
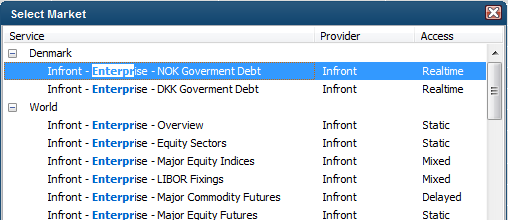
Plus PagesIn addition to the Overview page there are a number of other, Plus-specific, pages that can be opened from the Overview page. Some of the pages also have buttons to quickly open one of the other pages. You can also find and open these pages from the Select Market dialog (Ctrl+M) or from the search bar (Ctrl+F).
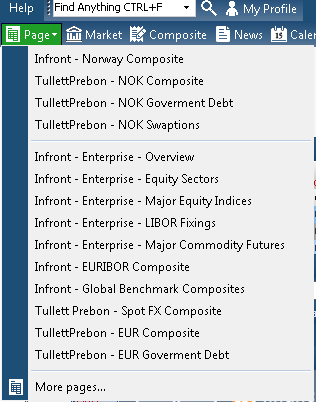
Page ButtonThe main toolbar now has a new button called Page – this gives you quick access to some of the key pages available to you – Plus-specific or otherwise.
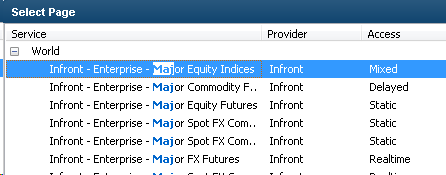
Click the More pages command at the bottom to open a Select Page dialog that gives access to all available pages. Just type to search for the one you need.
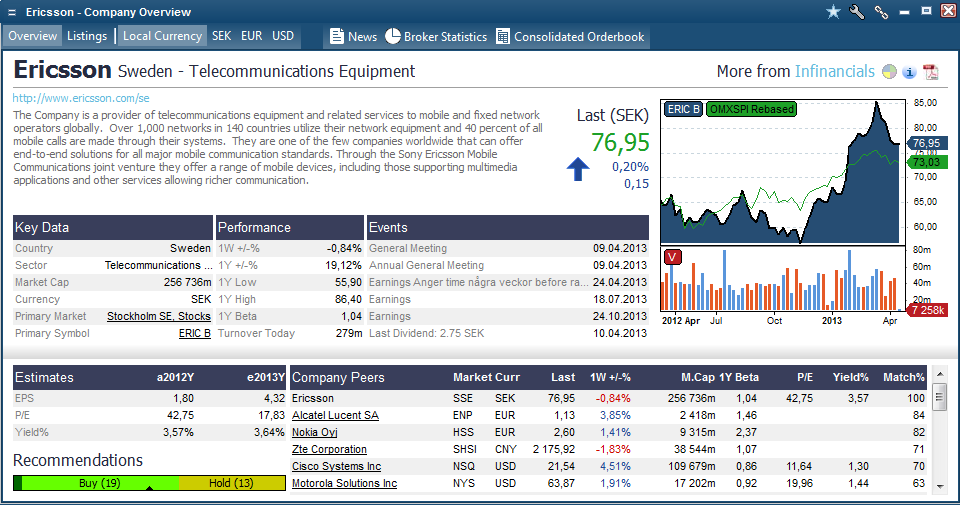
Company OverviewThe new Company Overview window integrates all the available information about a company from a number of sources. Instead of looking only at one specific stock of a company, this window gives the bigger picture and gives you quick and easy access to a lot of relevant information as well as the possibility to dig down for more details.
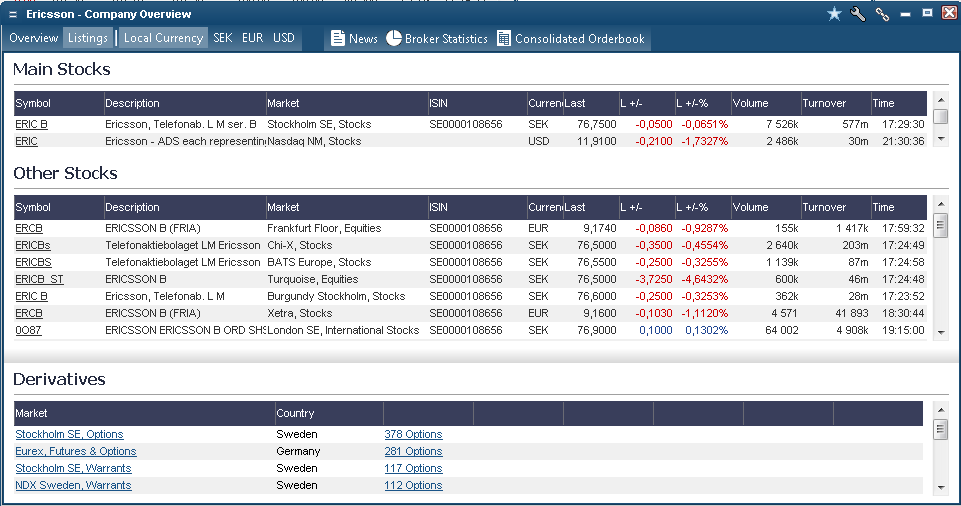
Open the Company Overview window by selecting it from the right-click menu, by pressing Ctrl+Shift+P or by searching for the company with Ctrl+F. Overview pageThe Overview page gives you the name, country, sector and homepage of the company. The description, Key Data and company peers list is sourced from Infinancials. Click on the primary market name to open a market window. Click on the primary symbol to open a symbol window for the main stock. The last price and today's change is shown next to the description and the Performance section shows selected historical performance numbers, both sourced from Infront realtime servers. Click on the Performance heading to drill down to more performance numbers. The Events section lists the upcoming company events and last dividend information, sourced from calendar events providers like Direkt, Dow Jones and EDI. Click on the Events label to drill down for more. The Estimates section show key reported (actual) and estimated values and buy and sell recommendations, sourced from SME Direkt and Factset. Click the Estimates label to drill down for more details. The Company Peers section list all the similar companies, sourced from Infinancials. The columns show the company name, the primary market data feed (if applicable), realtime Last price, trading currency, 1 week percentage change, P/E, Beta, Enterprise Value, Yield% and a Compare value (how similar the peer is considered the main company). Click the Company Peers label to open a Composite window with all the market data symbols. Click on a company name to open another Company Overview window. The Chart shows how the price of the main market stock has changed over 1 year. The charts includes a volume indicator and a rebased compare line against the main market index. Click on the chart to open a standalone chart window where you can do further analysis. Above the chart you will find a link to open the full Infinancials Investor+ window. The icons to the right give access to quick pop hints with extra information. At the top of the window is a toolbar where you can switch between the Overview and Listings page. By default all monatary values (like last price and enterprise value) are shown in the local currency. To make it easier to compare between peers and symbols using different trading currencies, there are three currency buttons, SEK, EUR and USD, that will convert all values to a single currency. The first of these (SEK, in this case) will match the currency of the main symbol of the company. The toolbar also contains quick-access buttons to drill down to news, broker statistics, top investors and consolidated orderbook. Listings pageThe Listings page is used to get an overview of all the relevant stocks and other market data instruments related to the company and allows you to drill down to get more details.
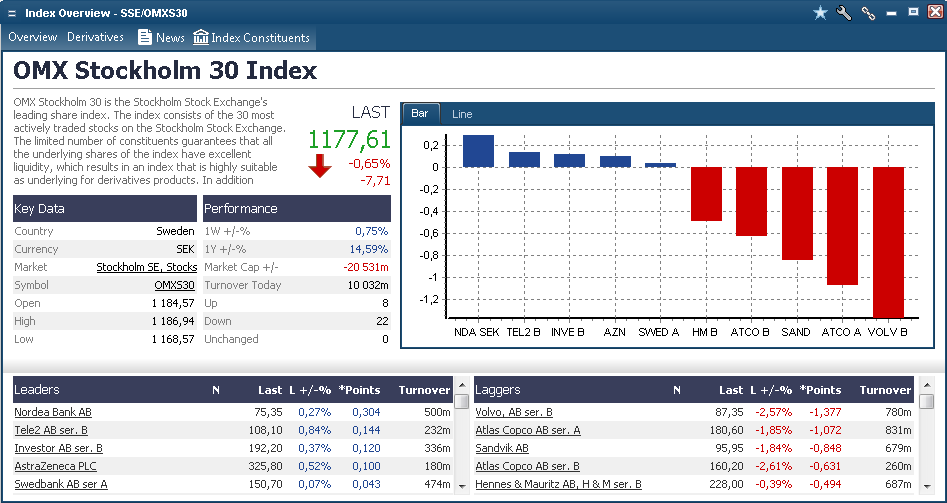
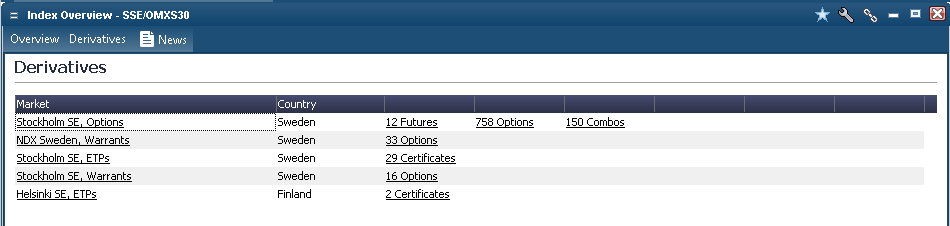
The Main Stocks section lists the primary stocks of the company. Click the Main Stocks label to open a Composite window with all the stocks, or click on the symbol ticker codes to open symbol windows. The Other Stocks section lists all the other stocks, like MTFs that also offer trading in the company stock. Click the Other Stocks label to open a Composite window with all the stocks, or click on the symbol ticker codes to open symbol windows. The Derivatives and Bonds section lists all other instruments types from difference market feeds, categorized into symbol types. Click the market descriptions to open a market window or one of the symbol types links to open a Composite window with the instruments. In this page you can also use the currency buttons in the toolbar to convert all monetary values to a single currency for easier comparison. Index Overview with "Leaders" and "Laggers"The new Index Overview window integrates all the available information about an index from a number of sources. Information vital to the index' development is put together and displayed in this window.
Open the Index Overview window by selecting it from the right-click menu, by pressing Ctrl+Shift+X or by searching for the index with Ctrl+F. Overview pageThe Overview page gives you the most important details at a glance. Hover over the index description to see the whole text if it is not displayed in its entirety. Several of the fields are clickable to enable further drilling down for more information. For example the you can click on the market name to open the market window and click on the symbol to open a symbol window for the index under the Key Data heading. In the Leaders and Laggers table you can go to look at more details related to the specific symbols. The last price and today's change is shown next to the description and the Performance section shows selected historical performance numbers, both sourced from Infront realtime servers. Click on the Performance heading to drill down to more performance numbers. The Bar Chart shows the top 5 leaders and laggers currently moving the index. Click on the Line tab to display an intraday chart of the index. Click on the chart to open a standalone chart window where you can do further analysis. At the top of the window is a toolbar where you can switch between the Overview and Derivatives page. The toolbar also contains quick-access buttons to drill down to news related to the index Derivatives pageThe derivatives page is used to get an overview of all the relevant instruments derived from the index and allows you to click and drill down to get more details. Clicking on an option group takes you straight to the put/call view.
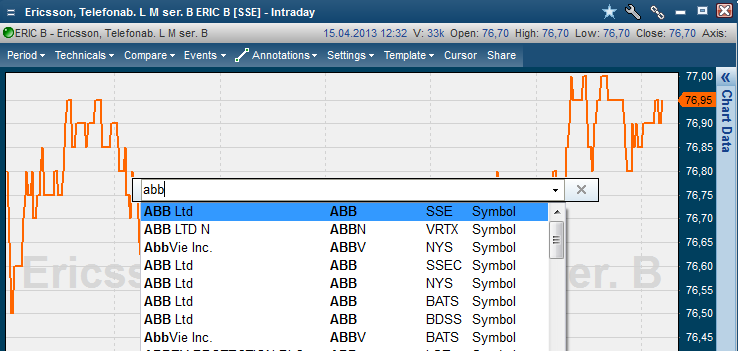
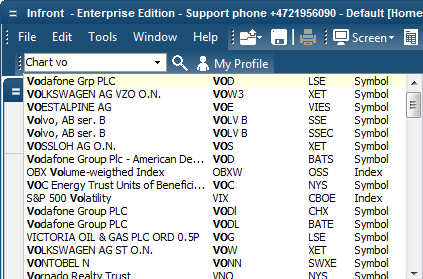
Quick Search to switch contentsMost windows allow you to switch contents just by starting to type. For instance, in all symbol windows (like quote overview, chart, orderbook etc) you can type a ticker code or (part of) a description to quickly find and go to that instrument.
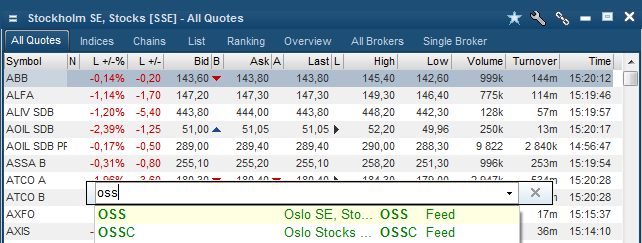
Note that matching will start immediately for symbols that have already been downloaded in a market window or other windows - this makes it lightning quick to switch between the instruments you know. If there are no local matches or you wait a second, you will also get matches on all available markets. Press Enter to select the highlighted top item, press the down arrow key to select items further down in the list. Press Escape to close the search box without changing the selected symbol. From a market window, you can start typing to search for symbols in the current list (to change focus/link to that symbol) or for market feeds to change what market to display.
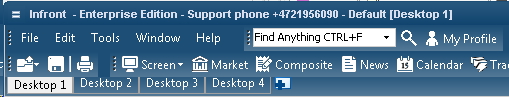
In the Chains list of a Composite window, you can start typing to search for any available chain. This is an alternative to browsing the available chains by pressing the Edit button on the Composite toolbar. Search and Command (Ctrl+F)In the main window, along with the other toolbars, there is a field where you can search for anything and perform commands.
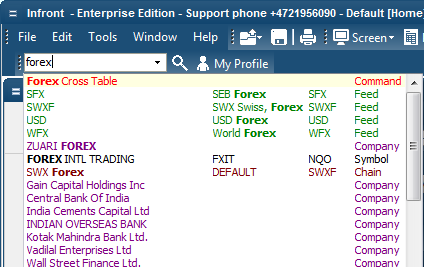
To start searching, click in the box or just press Ctrl+F. Here you can search for companies, symbols, chains, pages, markets, and commands, just start typing. Each kind of match result is indicated by a colored category text.
To select the top, highlighted match, just press Enter. To select another result, click it or select it with the down arrow key and press Enter. To clear the search, press Escape, or focus another window. Depending on what kind of item you select in the search results, different windows will open.
CommandsThere are two types of commands - with and without parameters. Parameter-less commands complete once you select them - they will immediately open the window they represent - for instance, Forex table, Help, Composite and Twitter. Other commands take a single parameter - once the command has been found and selected, a new search that matches the parameter type will start. This makes it easy to quickly open a chart or orderbook for a specific symbol, for instance.
To make it quicker to search for and use commands, you can start typing the beginning of the command and then press the Tab key. This will skip all other search results, and select the first matching command item. The full list of available commands at this point is (may be expanded in future versions): Help
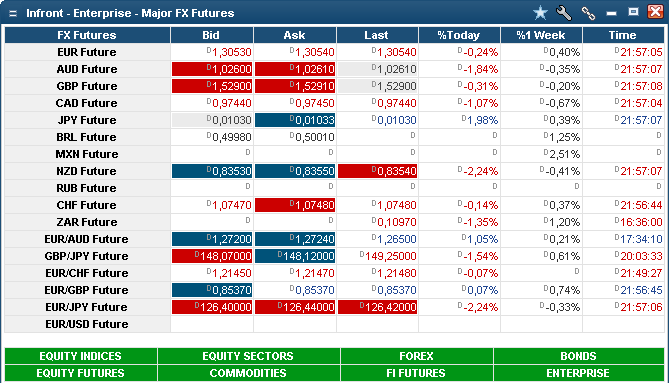
Use the last six commands as a quick and easy way of filtering the search results so that you only see matches of a specific type. FavoritesYou can create short-cuts to your favorite markets, charts, market pages etc. by clicking the star icon in the top-right corner of the window.
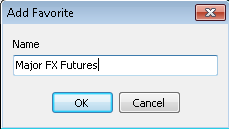
Name your favorite, click OK...
... and have it ready for quick-access from the toolbar.
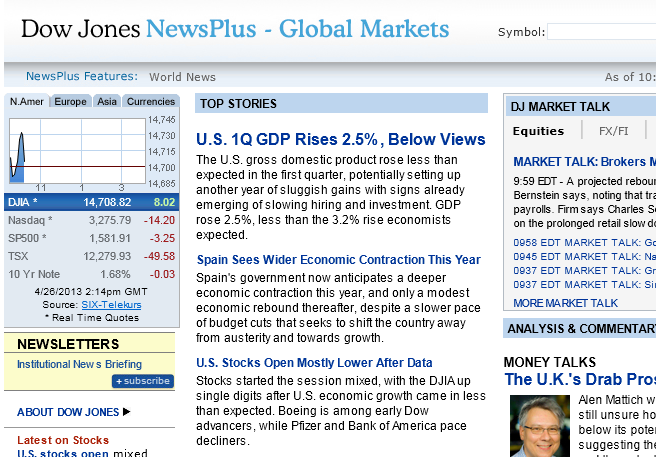
Order MonitoringThe Order Monitoring module is now part of the Plus Edition. Program TradingThe Program Trading module is now part of the Plus Edition. News improvementsDJ NewsPlusIf you have access to one or more Dow Jones News services, you will now also get a new DJ NewsPlus button on the main toolbar.
This gives access to the DJ NewsPlus service in an integrated web browser window.
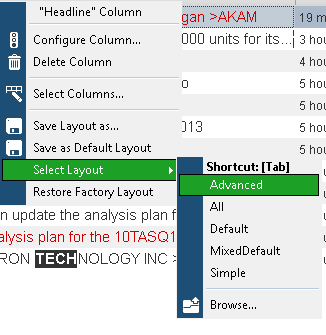
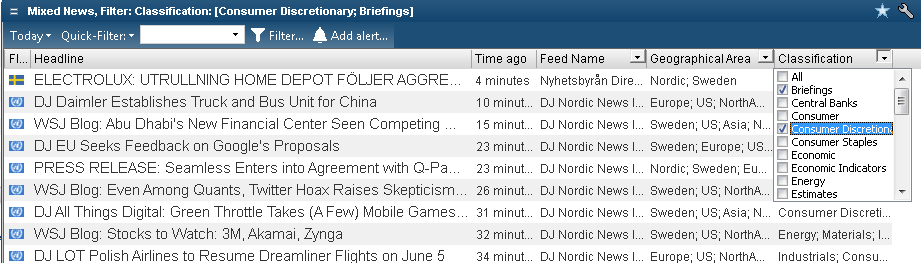
Toolbar cleanupWe have simplified the toolbar in the news list window and added controls to perform quick filtering and highlighting of the news items. To change news sources or select a saved filter, use the right-click menu. News column layoutsThere are new column layout defaults for single source and multiple source news list windows. There are new commands in the column right-click menu to let you save and use custom column layouts. Press Tab to switch between the available layouts.
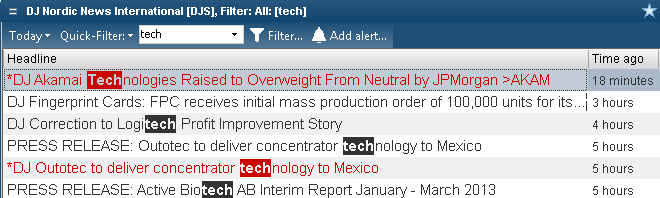
There is a new Time Ago column that shows a relative time indication for how old each news item is. Quick-filteringJust start to type to set a filter that will only show news items that match (in any field) the text you type in.
Quick-highlightingClick on the mode button in front of the text field and select Quick-highlighting - now no filtering will occur, but text matches in the headlines will be shown. Column filteringCertain columns allow you to easily set up a filter just by using a drop-down in the column header and checking the values you want to see.
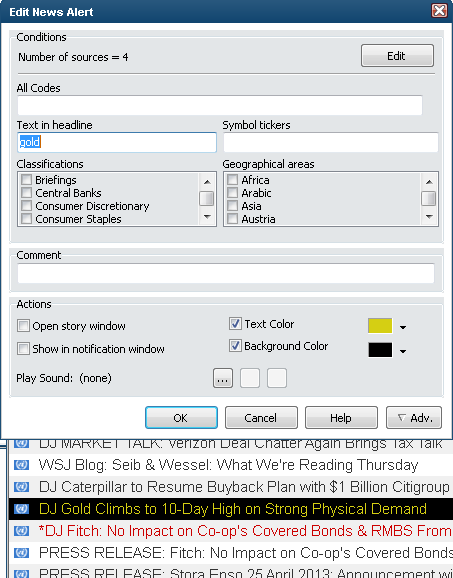
This can also be used as a way of quickly selecting a news source, by using the drop-down on the Feed Name column. Automatic Coloring of certain news itemsThe possible actions of a news alert have been extended with controls to set the text and/or background colors of news items that fulfill the criteria of the alert.
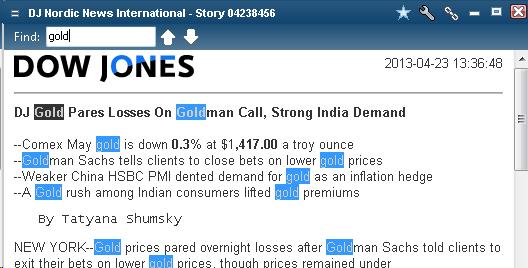
For instance, the alert above will show all headlines that contain the text "gold" with a black background and a golden text color. These alert colors applies to all news windows that contain the selected news sources. Text searching in news storiesIn news story windows, you can now search for any text in the body - the matching strings will be highlighted.
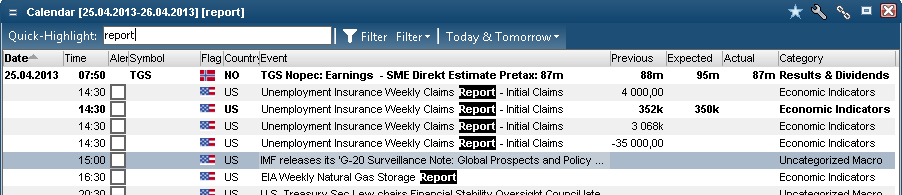
You can press the up and down arrows in the toolbar to move focus to the previous and next matches (or use the corresponding keyboard shortcuts Enter and Shift+Enter). Market Calendar improvementsThe Market Calendar window has had a number of improvements. |
| • | There is a new Quick-Highlight field - any text you enter here will be highlighted in the event descriptions. |
| • | Event items that have Expected numbers are emphasized with bold text. |
| • | The date column indicates when the date changes, instead of repeating for each line. |
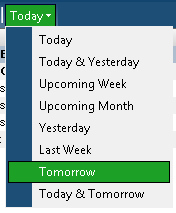
| • | Tomorrow and Today & Tomorrow have been added as available predefined periods. |
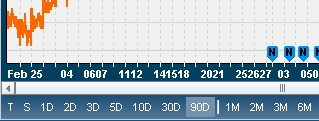
Plus users have extended time-series available compared to other users. The number of intraday chart data has been extended from 30 to 90 days (lower limits may apply to some markets).
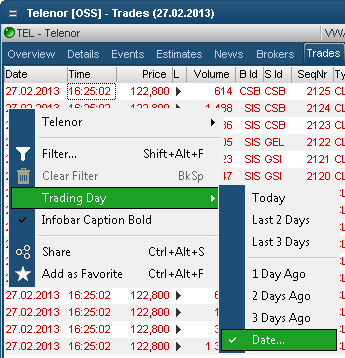
It is now possible to see the trading lists up to 90 days back in time.
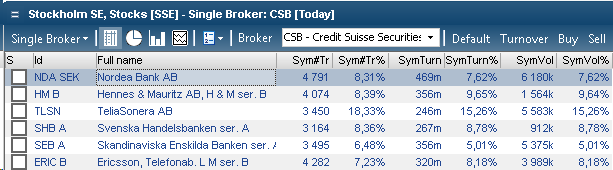
The Single Broker page of the Broker Statistics window now supports new columns that show a broker's activity in each symbol compared to the whole market.
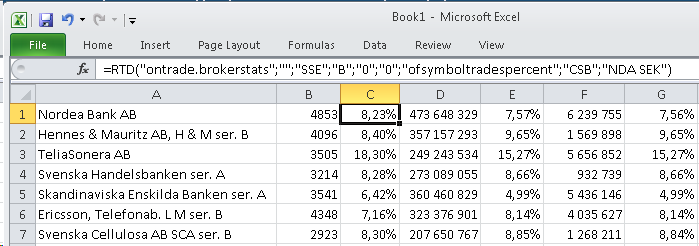
It is now possible to link realtime updated Broker Statistics data directly into an Excel sheet using RTD links. To easily create new RTD links select an area in a Broker Statistics window and select Edit | Copy RTD Link (or press Ctrl+R).
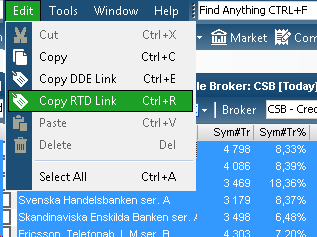
You can now paste the links into an Excel spreadsheet and the values will update realtime: