Infront Professional Terminal
What's new in IPT version 8.6.600
ESG data launched in Infront Professional Terminal
We are pleased to introduce an advanced ESG dataset in the latest version of our Professional Terminal - 8.6.600
Adding to the Infront Professional Terminal's extensive data universe, ESG data is seamlessly integrated through new and familiar functionality to help you effortlessly incorporate ESG in your daily workflow:
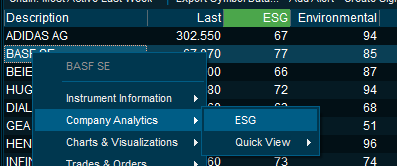
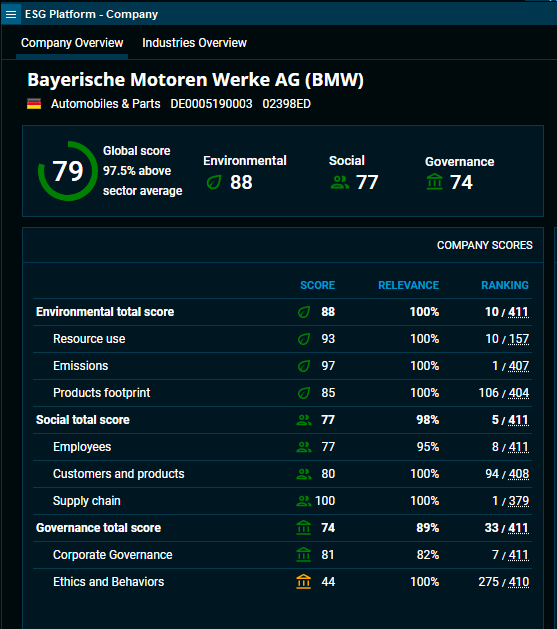
- A new ESG Platform visualize and contextualize three levels of data on a company level easily accessed from the right click menu of a company (or you can double-click on any ESG column):
- Scores are color coded based on performance in addition to visual elements for their respective category within Environmental, Social or Governance.
- The ESG dataset is based on scores ranging from 0-100 with 100 as the best and covers companies, funds and governments. The scores express the risk and opportunities the company holds against key exposure points within the respective specific sector.
ESG Risk scores aims to assess the financial materiality of environmental, social and governance issues related to how companies and governments operate. Hence, scores assess how ESG issues potentially affect future financial performance. Companies in the same industry generally face the same major risks and opportunities, though individual exposure can vary.
ESG Risk scores allows investors to assess how well the companies and countries in a given portfolio are managing their Environmental, Social and Governance related risks and opportunities.
A risk is material to an industry when it is likely that companies in a given industry will incur substantial costs in connection with it (for example: regulatory ban on a key chemical input requiring reformulation).
Furthermore, a new regulation coming into place can correspondingly shift the scores of an entire sector and in turn develop depending on how the companies individually address this regulation.
As such the risk score can be interpreted as to what extent the company has mitigated risk or holds exposure towards ESG factors faced in the respective sector. Both the exposure and the potential impact on financial materiality is weighted into a risk score.
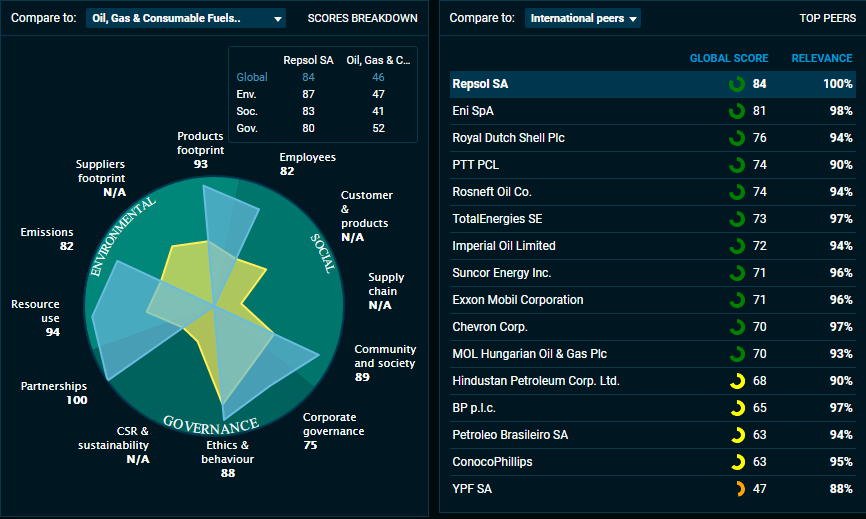
As an example, this is why Repsol as an oil and energy company can hold a higher environmental score at 87, than Vestas Wind at 59. This tells us that Repsol have mitigated their exposure to a larger extent or holds a more robust and diversified business model, better positioned for the opportunities within the oil and energy sector, which again may lead to strong future financial performance.
Detailed documentation on methodology and framework is available through our sales, support and client success team.
- The platform includes an Industries tab for deeper insight within a sector as well as configurable peer group analysis and graphics. Calculation method may be adjusted to your preference and the platform can also be linked to other windows as a familiar feature.
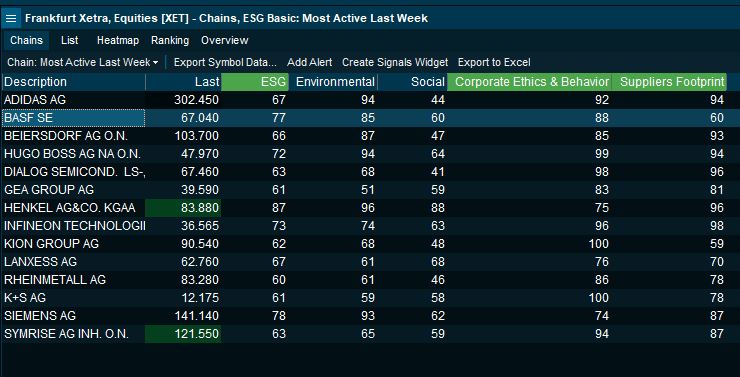
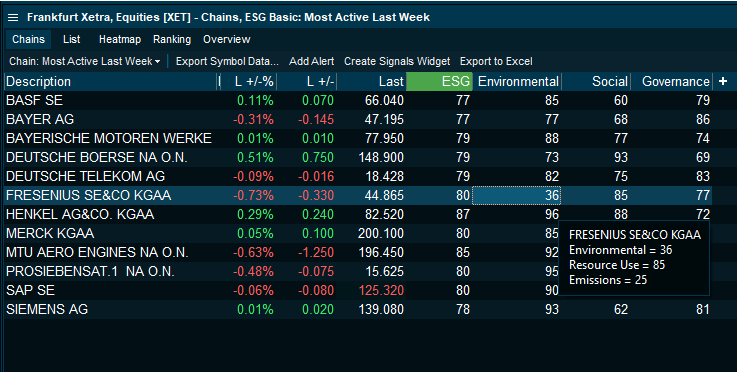
- A new column set is introduced to be applied in Market overview and Watchlists to bring forward this advanced dataset. Applying the terminal's column sorting and filtering, this enables you to easily screen and structure an entire market based on overall ESG score. Detailed parameters such as Supplier Footprint or Corporate Ethics may be applied as well as seen in the example with the Xetra exchange below:
- By applying the ESG Basic layout to the Xetra main market, we can filter out only the top ESG score candidates by sliding the bar in the column filter. We quickly find that even though Fresenius falls within this range at the total score, Fresenius' Environmental score is quite poor at 36 further explained by the third level parameters shown in the hover, clearly weakened by the Emissions score at only 25.
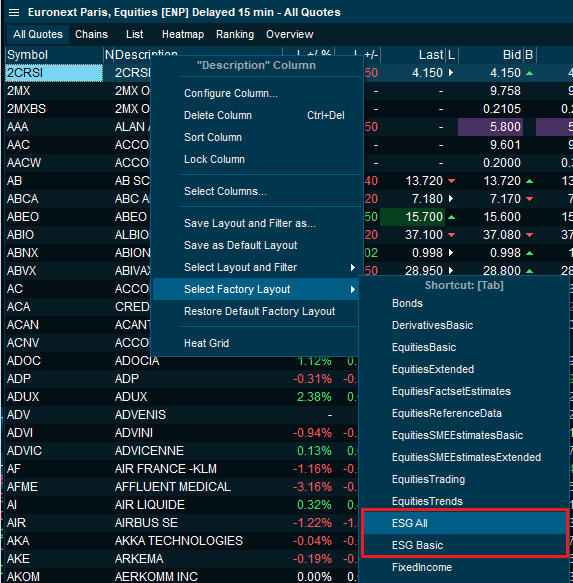
- In addition to a new column category found in the configurator, two new ESG layouts have been added to the factory layouts and can easily be applied to any market overview or watchlist.
The "ESG Basic" layout includes 2 levels of granularity, and the "ESG Full" layout naturally includes all the parameters for a more detailed approach:
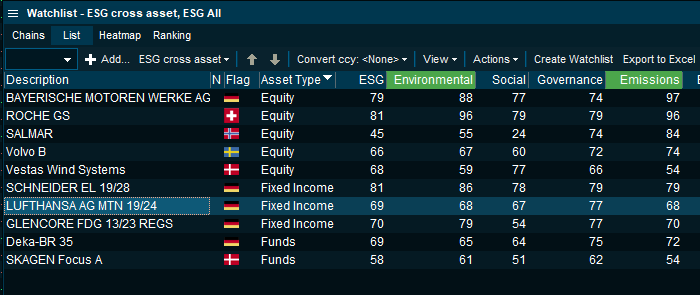
- The dataset covers Equities, Fixed Income and Funds so by applying the layout in a watchlist you may combine these for a cross asset overview.
- Individual scores are available in the details tab of every Instrument Overview window and included in the Peer group overview on the Company Overview tab.
For questions or additional information please refer to your respective Client Success Manager or reach out to our support.
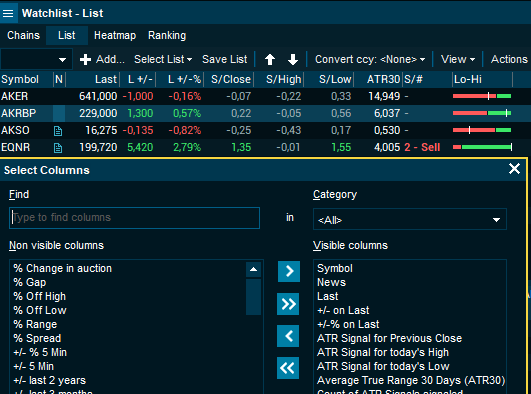
New columns for ATR-based day-trading signals
We have introduced four new columns related to the calculation of ATR-based day-trading signals.
Using the values of these columns (and the possibility to sort or filter to only see the interesting signals) can help you make decisions about when to buy or sell securities in the market.
ATR30 (Average True Range 30 days) is a column we already support, and it gives a measure of how much volatility there is typically/statistically the last 30 days in terms of nominal price changes.
This is used as the basis of calculating how much volatility there is in today's trading (measured in number of ATRs) - there are three such measurements being done:
- Change between previous close and high (S/High)
- Change between previous close and low (S/Low)
- Change between previous close and the current last price (S/Last)
Each of these is a signal, but we're only interested in signals of above a minimum strength. This is set to 1 ATR by default, but it can be configured in the settings to a value between 0,75 and 2 ATRs.
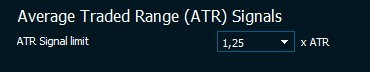
That limit settings indicates how aggressive or conservative you want to be in interpreting the signals.
The fourth column (S/#) is an aggregated count that will be 0, 1 or 2. It indicates how many of the three signals above currently has a value exceeding the ATR Signal limit.
It can be convenient to sort on or filter on this signal count column to only see the ones with 1 or 2 - as these will be the "interesting" cases in your universe of instruments (a market list or watch list). Normally, only a signal count of 2 should be considered a confirmed trigger.
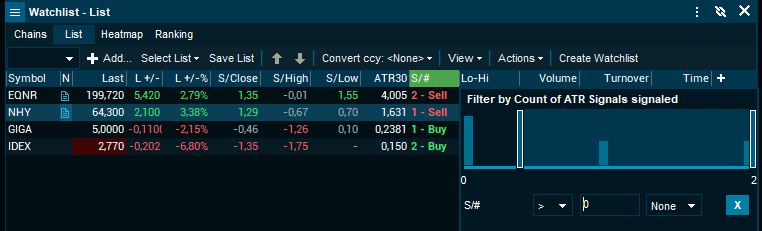
The count column will be red for a sell signal and green for a buy signal - the signal will be opposite of the recent (possibly exuberated) movement, the theory being that it will return to normal.
The different ATR signal columns will show a hint with additional detailed information. This can be useful to optimize space by reducing the number of columns shown, while still be able to quickly look at the details behind any of the scores:
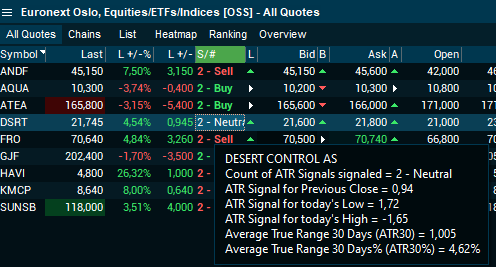
Notice that in some cases there can be two opposite scores, giving a score count of 2, but tagged as neutral.
To drill down further and see how the broken ATR levels show themselves in an intraday chart, it is possible to add various horizontal lines:
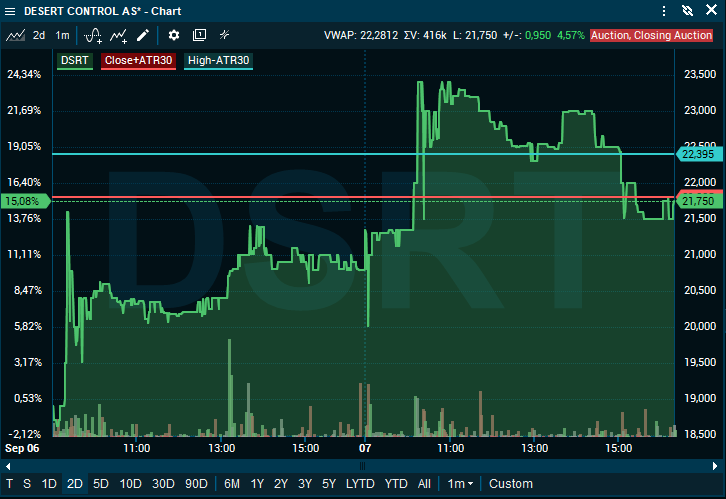
The chart above shows that intraday trading first broke the PrevClose+ATR limit (blue line), then it broke down falling below the High-ATR level (red line) - giving in total a neutral signal now. Earlier in the day, it would probably have given a sell signal.
Always consider other factors, such as fundamental news, and other technical indicators before making a trading decision.
What was new in 86.500 and earlier versions