Compare studies
A compare studie adds a second price line for another symbol to the chart. In the Compare drop down in the chart, select the type of compare study you want, then select what symbol you want to compare it to. Given two symbols A and B, the available options are:
| • | B - A (the difference between B and A) |
| • | A - B (the difference between A and B) |
| • | A * B (A multiplied by B) |
| • | A+/-% - B+/-% (A and B indexed to 0 in percent) |
The default compare field will be set to the same as the main line, normally the last price. It can be changed in the line properties dialog in the parameters section.
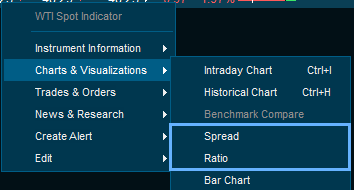
Spread & Ratio Analysis
By right clicking on a instrument and then select Charts & Visualization -> Spread or Ratio a new prompt will appear allowing for second instrument to be entered.
Once entered either a spread or a ratio study will be created on the two selected instruments. The spread/ratio is also presented with additional chart data. The chart data is based on the selected time period of the chart.
|


