Chart Grid


Chart Grid |
|
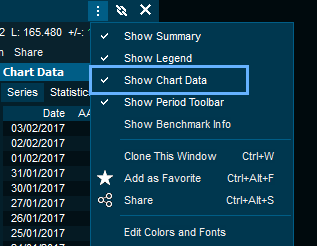
DescriptionIn the chart window, a grid containing data series and statistics for all graphs can be expanded into view.
In some cases the grid will be hidden by default. It can be viewed by selecting chart-menu -> select Show Chart Grid. When displayed, you can change the width of the grid by click and drag the vertical splitter line between the grid and the chart itself. From the right-click menu in the grid, it is possible to hide the date and or the time column. The width of each column will be saved as a part of the workspace. It is possible to copy all the data from the columns into the clipboard. Use the Ctrl+V short cut to select all (or use the menu Select All in the right click menu) and then Ctrl+C to copy. The selected row in the grid works along with the chart cursor. When the cursor is active, the selected row will follow any movement to the cursor. |