What's New in 4.6


What's New in 4.6 |
|
|
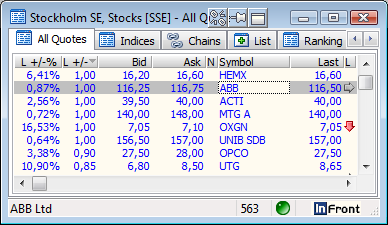
Version 4.6 is an important update and includes a number of new features and bug fixes It is recommended for all users. Market & Composite windowRankingThe ranking window has been extended with the following new functions:
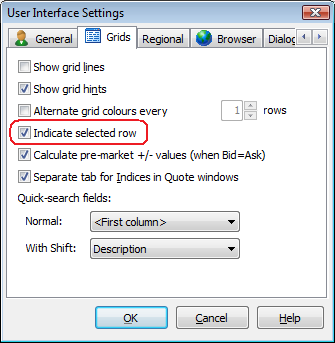
Indicate selected rowThere is a new feature to indicate with a (configurable) background color what is the selected row in a grid.
This option is off by default, but can be enabled with a new “[X] Indicate selected row” option in the Tools | User Interface Settings dialog, on the Grids page.
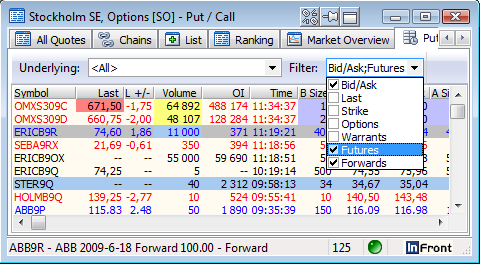
Put/Call: New style toolbar and Futures/Forwards filterThe toolbar in the Put/Call page has had a minor face lift. In addition there are two new filters that only include Future and Forward instruments.
Empty charts are hiddenThe charts In the Market Overview page of the Market window will now be removed if they don't have any contents. This includes the market index intraday chart and the "% of shares traded" bar chart. Symbol windowHistory tab improvements
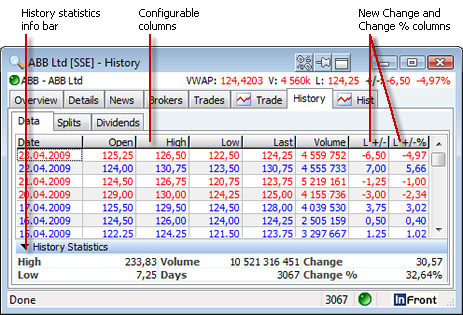
The history tab has been updated with the following new features:
There are now a number of new columns available in the History list. What column values are available and how far back in time they are present vary between markets and columns. The new columns are:
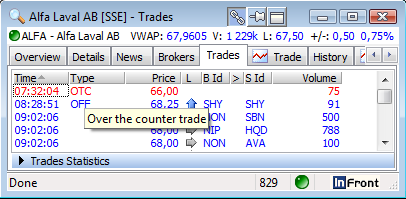
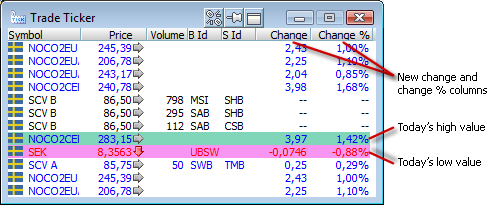
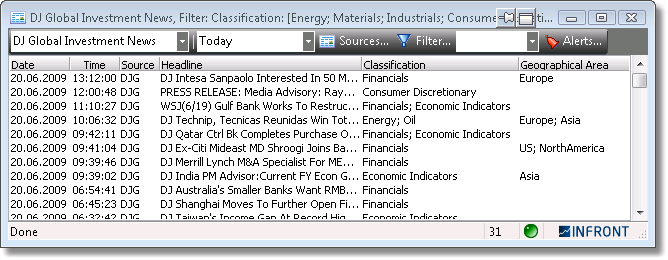
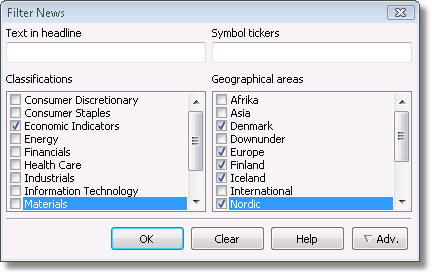
Trades tab improvementsYou can now select what trading day back in time you want to see trades for. If you have configured a filter on the Trades list, this filtering is kept in the workspace and if you change the symbol. Simplified historical news selectionThe toolbar is reduced to only one drop down menu, which selects the preferred period the news should be displayed for. By default, only the today’s news is displayed in the grid. By changing the selection, all available news items are displayed for that period. Show hints for trade type abbreviationsThere is now a mechanism to show longer names or explanations of trade type abbreviations in the trades list.
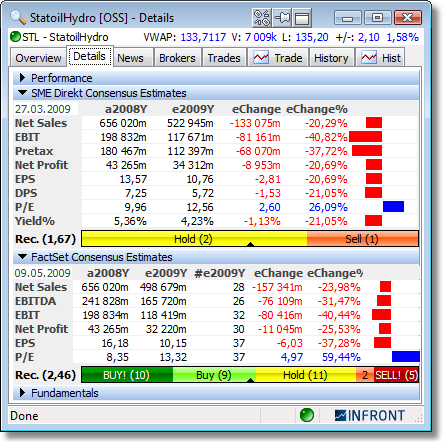
Note that the mapping from abbreviation to long name needs to be configured centrally for each market. Results and EstimatesSymbol window: SME Direkt Level 1 and FactSet sectionsThe application can now show key ratios of the last yearly result and the next yearly estimate from both SME Direkt Level 1 and FactSet. These are now displayed in separate sections in the Details page of the Symbol window.
The key ratios that will be included in the SME Direkt Level 1 package is Net Sales, EBIT, EBITDA (when available), Net Profit, EPS (Earnings per share) and P/E (Price / Earnings). The same set of key ratios will be available from the FactSet service. In addition to the last year’s result and next year’s estimated numbers, the nominal and percentage changes are calculated and shown graphically. This gives a quick overview of the expected changes in the coming year. Note that more comprehensive SME Direct Level 2 package will become available later; these will give access to more key ratios (DPS, Yield%, EBITA, Pretax and Gross Profit), quarterly results and estimates, and cover more years. A Level 3 package will give access to even more per company details and drill-down of results and estimates. SME Direkt and FactSet Results and Consensus EstimatesSymbol window: SME Direkt Level 1 and FactSet sectionsThe application can now show key ratios of the last yearly result and the next yearly estimate from both SME Direkt Level 1 and FactSet. These are now displayed in separate sections in the Details page of the Symbol window.
Key figures includedThe key figures included in the SME Direkt Level 1 service are:
The key figures available from the FactSet service are:
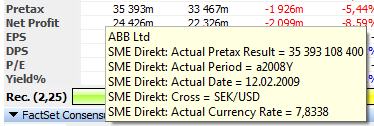
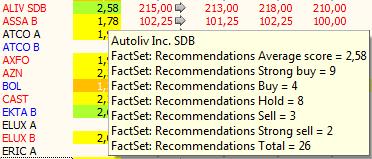
In addition to the last year’s result and next year’s estimated numbers, the nominal and percentage changes are calculated and shown graphically. This gives a quick overview of the expected changes in the coming year. The date in the upper left corner of the grid shows the date the estimates are from. Number of ContributorsFor the FactSet values, there is a separate column with the number of contributors (analysts) to each key figure. Currency conversions Recommendation barAt the bottom of each section we show a graphical representation of the consensus recommendations from the analysts. It shows up to 5 different level of recommendations: Strong buy, Buy, Hold, Sell, Strong Sell. Each level is color-coded with shades of green for buy, yellow for hold and shades of orange and red for sell. The number of votes in each category is shown and the width of the color bar is relative to the total number of votes. The middle of the recommendation bar is indicated with a small black arrow and indicates the balance point or average recommendation value. The same value is shown numerically in the label to the left of the bar. The average recommendation value range is from 0 (Strong sell), via 2 (Hold) to 4 (Strong Buy). Hints with more detailed informationIf you hover the mouse over the value columns, additional information will be shown.
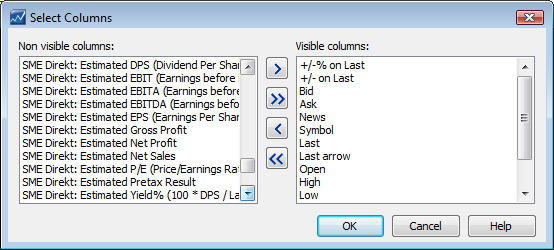
Market window: New Result and Estimates columnsThe new result and estimates key ratios from SME Direkt and FactSet are also available as columns in the market window. There are separate sets of columns for the two services. Double-clicking a fundamental column will open the the Details page for that symbol. The background color of the Recommendation columns indicates what direction the value represents (buy, hold, sell). The short and long names of these columns are prefixed with “S “/”SME Direkt:” and “F “/”FactSet:” to make it easier to see what source the values come from.
In addition there is a set of columns labeled “Merged” – these columns will show SME Direkt numbers when available, otherwise FactSet numbers. This makes it possible to have just one set of Result and Estimate columns that displays the “best” source available. Some columns will now show additional information in the cell hint. This way you have quick access to more detailed information without adding too many columns.
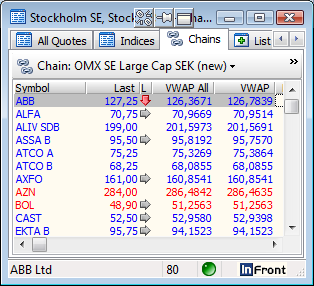
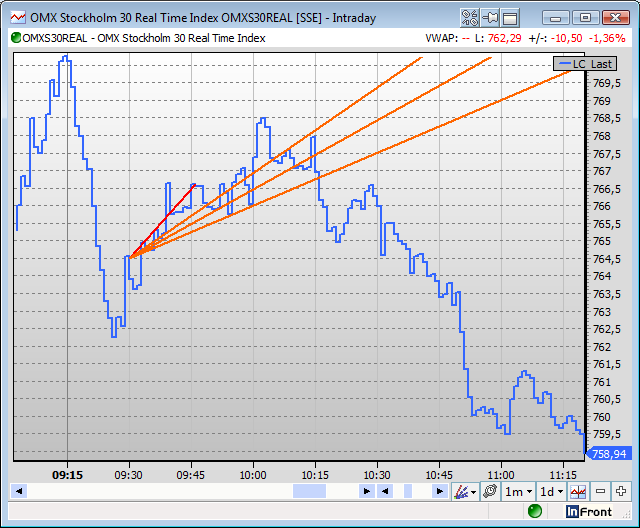
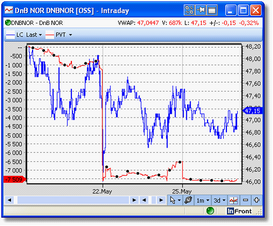
Market Information VWAP AllWe now support calculating and displaying VWAP All - Average Price, All Trades (including off-floor trades), in addition to the existing VWAP field (that only take on-floor trades into account). VWAP All can be displayed in the Market and Composite windows.
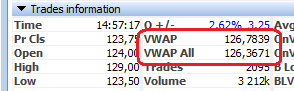
And in the Symbol window.
Note that the VWAP All value will only be displayed in the Symbol window if it differs from the VWAP field. Pre-market Change calculation support IndLast and IndOpenBefore the market opens, the client already supports calculating anticipated +/- and +/-% values by using crossing Bid and Ask prices. Now we have extended this logic to support using the Indicative Last and Indicative Open fields available from some markets. New columnsThe following new columns are now available:
Index weights for Index ConstituentsThe application now supports showing a column with yesterday's index weights for Index Constituents chains. Ticker window
The ticker window has been enhanced with the following new features:
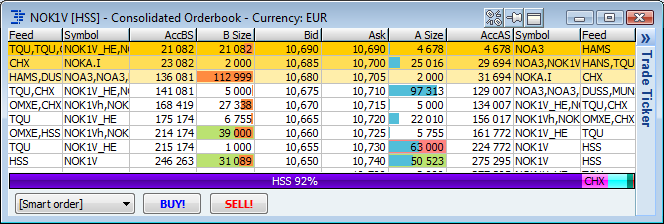
Consolidated orderbook |
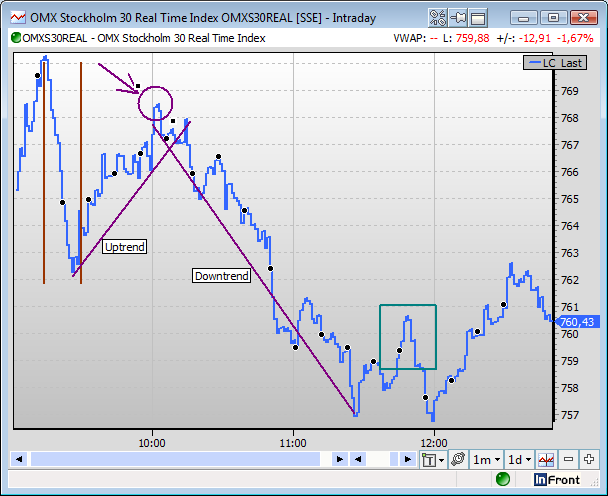
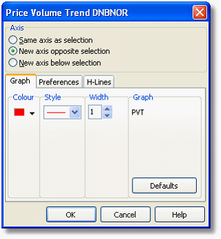
| • | A study can be added on a second (left) axis, i.e. the opposite of the default right axis: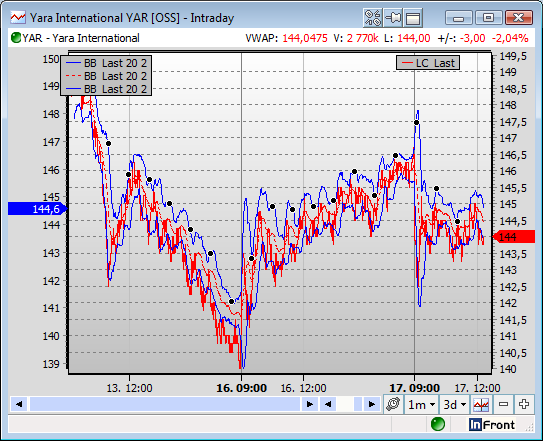 |
| • | All studies that are added below the main graph are created with a smaller relative height.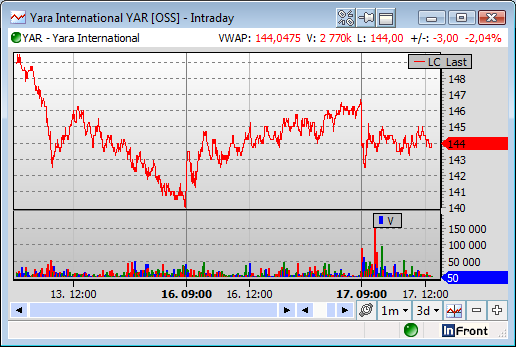 |
| • | The left and right margins are automatically adjusted to what takes most space. If the last value marker is not displayed, the margins will be adjusted to the axis labels. The font type for the last value marker can now be configured. |
| • | There are more chart resolution options for intraday charts, 2, 3, 4, 10 and 20 minutes. Also, there is a new input dialog to set a custom resolution between 1 and 59 minutes. |
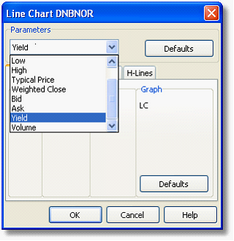
| • | A new compare study which gives the possibility to chart % change for two or more symbols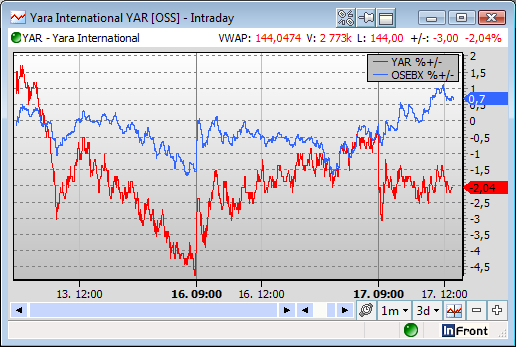 |
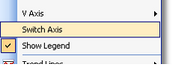
| • | The axis can now be inverted. To do this, right click on an axis and then select “Invert” from the popup menu. |
| • | It is now possible to set chronological bottom axis for intraday charts. In the chart setup dialog, a new checkbox will set chronological axis as default. This will for example chart any changes (if any) during weekends. 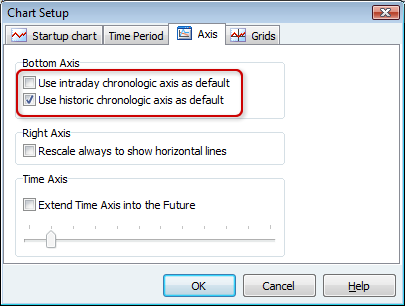 |
| • | “Last marker” font can be changed in the standard font property dialog |
| • | Chart cursor font and color can be changed in the standard font and color dialogs |
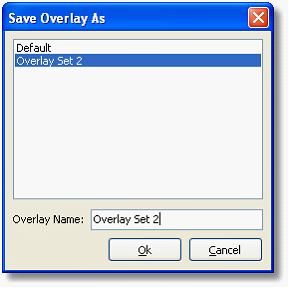
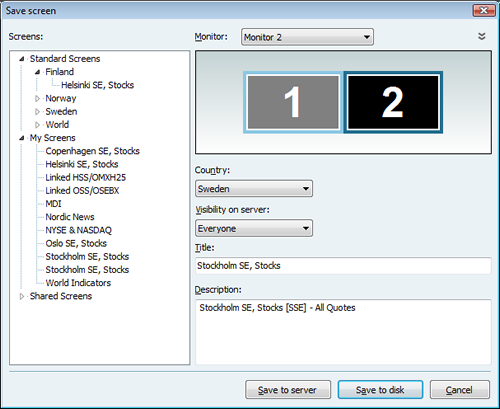
There is now a new mechanism to rapidly build workspaces. By selecting File | New | New screen a screen file containing a predefined group of workspace windows can be loaded into the workspace. Screen files can either be downloaded from the server, from the local hard disk or from a shared repository.
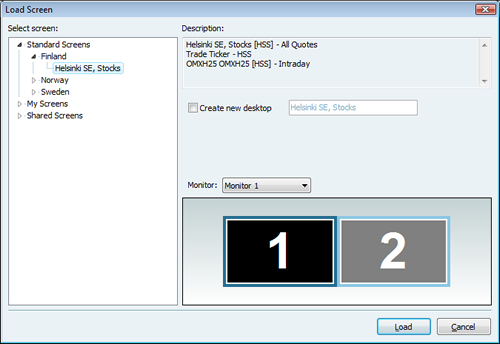
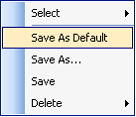
Users may also save their own screens for sharing with other users.
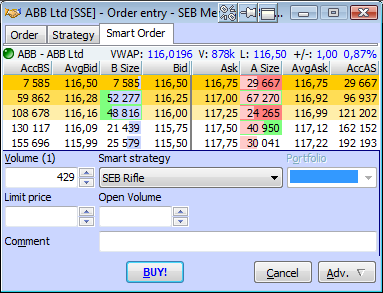
The order entry window now supports strategy based smart orders. The smart order strategies are displayed in a separate tab.
When inserting slice orders the user interface has been improved to simplify the order entry process.
If an order has been deleted or fully executed while having a modify order window open on the order, the Buy and Sell buttons will now be disabled and a warning text will be made visible below them.
For symbols that have the board lot set to 1, a new mechanism has been introduced to provide meaningful volume steps when increasing or decreasing order volumes.
This feature is enabled by default and can be configured from the Tools | Order entry Settings dialog on the Defaults page. A step value must be specified in a given currency. A rounding value may also be provided to round the the resulting volume lot value. If no rounding is desired, the rounding value should be set to 1.
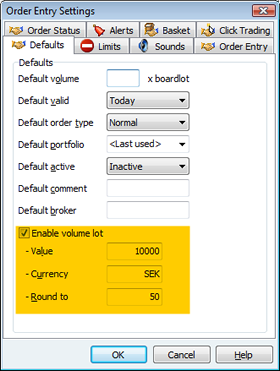
Note that symbols that have the board lot set to anything other than 1, will use the board lot and not the volume lot.
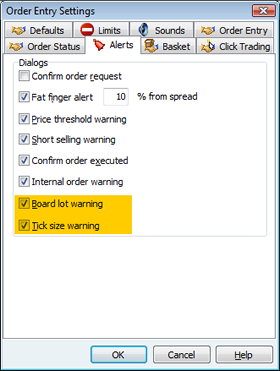
The order entry now checks for board lot and tick size violations when placing an order.
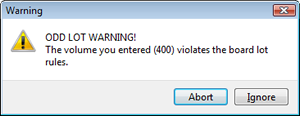
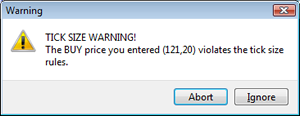
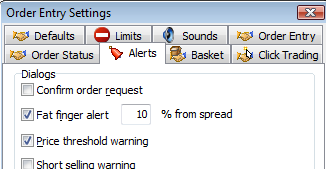
These warnings can be enabled / disabled in the Tools | Order entry Settings dialog on the Alerts page.
There are now new configuration settings to decide if you should hit (the default) or join the orderbook when double-clicking.
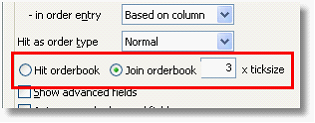
When joining the orderbook you can specify how many ticks below the best level you want to join (default 0).
Order Entry functionality
The order entry login window has been enhanced to support a branded look-and-feel. This is configured on per-provider basis and works by using a custom HTML page. For instance, the KBC order entry login may look like this:
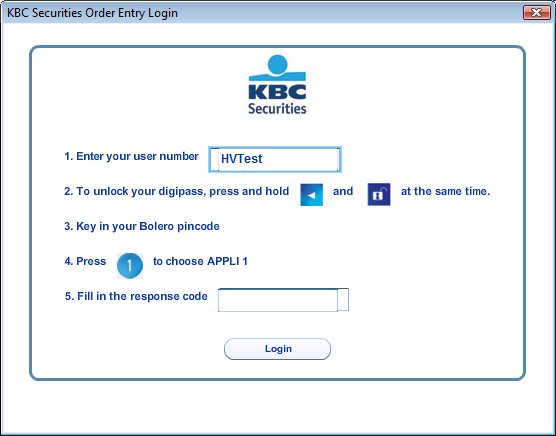
The HTML template is downloaded from a web-server. If the web server or template is not available, the non-branded login dialog will be used instead.
Some markets provide explicit limits to the highest and lowest price allowed to trade on for each symbol. These limits are called Upper Threshold and Lower Threshold. These fields are now available as columns in the Market and Composite windows.
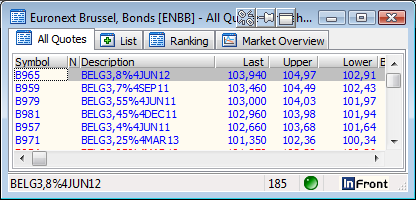
The fields are also visible in the symbol window (when applicable).
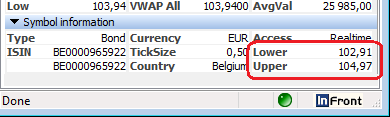
By default the limits will be checked and a warning displayed if they are violated when trying to insert a new limit order.
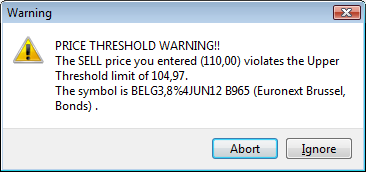
The checks can be turned off in the Tools | Order Entry setting dialog, Alerts page, [ ] Price threshold warning.
| • | The application now supports the native alpha-numeric order and trade ids that are used in some order managements systems (e.g. Ullink). |
| • | The list of available strategies can now be limited to a specific set of marketplaces |
| • | A separate server-controlled flag is now supported for modifying Strategy orders with remaining or original volume |
Order Status window
The order status window now includes improved support for multiple currencies. Totals on the Orders, Trades and Portfolio tabs are currency aware and can be displayed in a selected target currency.
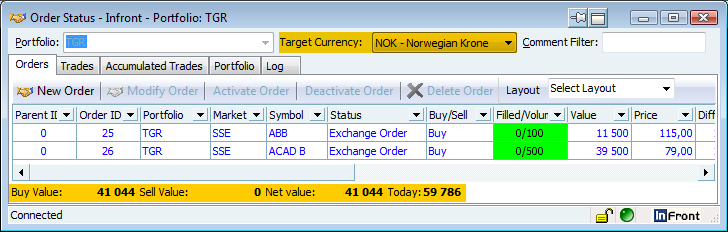
The Order Status window now supports the linked windows feature. When an Order Status window is linked you can double-click on one of the symbol ID fields (Ticker, ISIN, ExchchangeID) to change the linked symbol on that page.
![]()
Note that this functionality only applies to the Orders page.
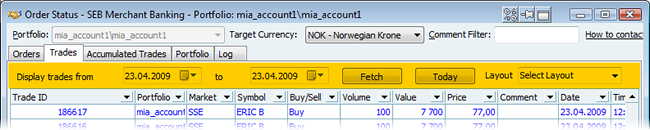
The controls for selecting trade dates are now hidden if this feature is not supported by the server.
The portfolio page now includes a new column showing today's gain/loss.
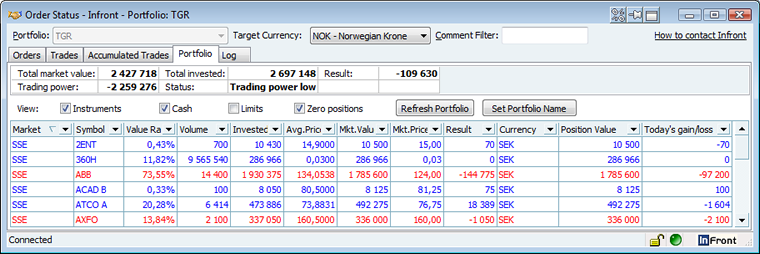
The page also includes visual enhancements for better readability.
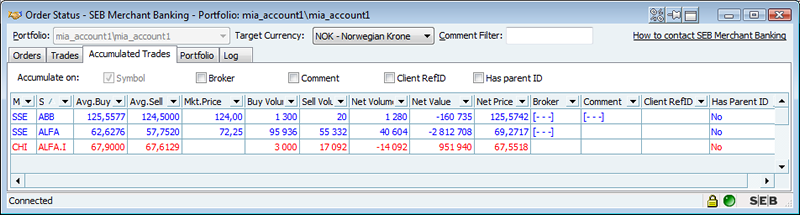
The accumulated trades page now includes the following new columns:
| • | Broker |
| • | Comment |
| • | Client Ref ID |
| • | Has Parent ID |
The accumulation settings also includes four new options:
| • | Accumulate on broker |
| • | Accumulate on comment |
| • | Accumulate on client RefID |
| • | Accumulate on has parent ID |
The basket trading window now has a new option to reverse orders. This is done by selecting one or more orders and clicking reverse orders from the context menu.
Orderbook / Order Entry
All windows with orderbooks in them (Symbol window, Orderbook window, Order Entry window and Consolidated orderbook) will now indicate at what price level you have active orders by using a yellow (configurable) background color in the Bid and Ask price columns.
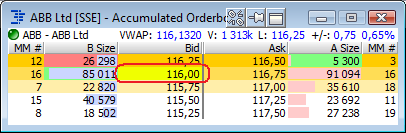
For instance, in this orderbook window we can see that we have an active buy order on ABB at 116,00. The background color used can be configured separately for buy and sell orders.
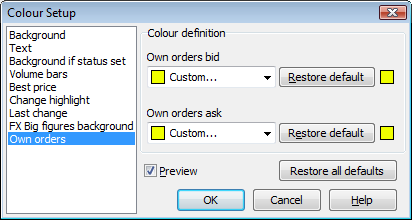
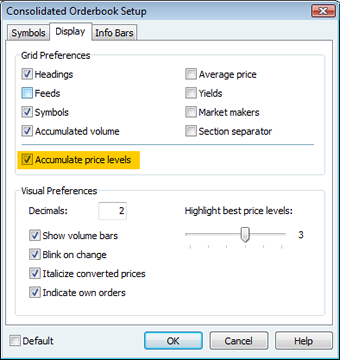
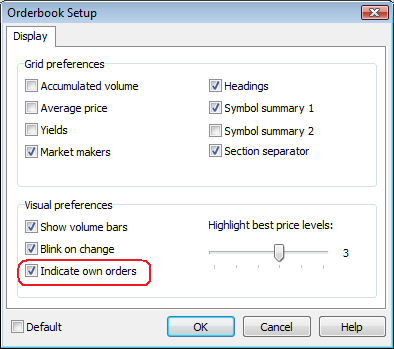
The feature is on by default, but can be turned off by using the Orderbook Setup dialog.
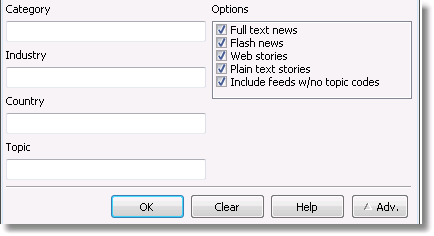
A new window which gives the ability to insert, modify and delete own news stories. The news will be broadcasted on a feed specified by the author.
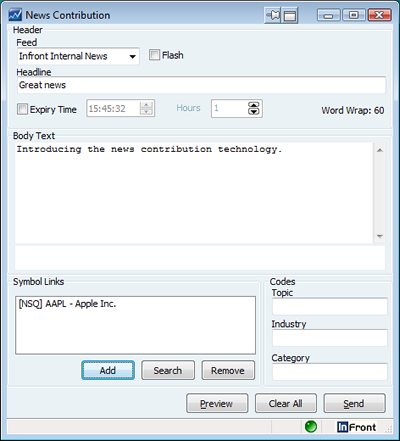
The window has the following features:
| • | Select a feed were the news story will be broadcasted |
| • | Specify if the news story is a flash |
| • | Headline with the ability to specify flash and attached symbol ticker |
| • | Article view with the ability to automatically insert a disclaimer |
| • | Set a expiry time for the news story (optional) |
| • | Add one or more symbol links (news story reference) |
| • | Add topic codes, industry codes or category as a news story reference |
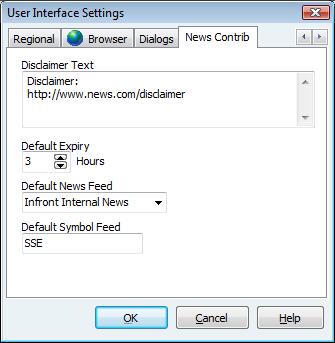
The user interface dialog has been extended with a new page for setting news contribution defaults:
| • | Disclaimer text will be automatically added to the news story |
| • | Default expiry time (if used) |
| • | Default news feed, selected when the news contribution window is created |
| • | Default symbol feed, selected when quick searching for a symbol to attach to a news story |
From the (mixed) News window, all inserted news stories can either be deleted or modified.
The news reader window now dynamically supports both the existing pure text-based news stories and rich news stories rendered using HTML (but without requiring a web browser or web server).
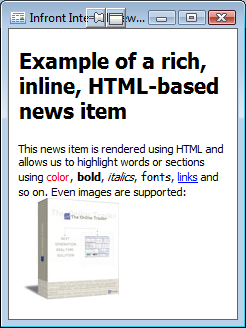
The source of this news item was:
<html>
<body>
<h1>Example of a rich, inline, HTML-based news item</h1>
This news item is rendered using HTML and allows us to highlight
words or sections using <font color=red>color</font>, <b>bold</b>,
<i>italics</i>, <font name="MS Comic">fonts</font>,
<a href="http://www.goinfront.com/">links</a> and so on.
Even images are supported:<br>
<img src="http://goinfront.com/elements/box_web.jpg"/>
</body>
</html>
This allows news agencies to send out news items with richer formatting such as colors, fonts, tables, images (the image linked to must reside on a web server). CSS style-sheets are also supported.
| • | The Find Symbol window now supports multi-selecting by pressing Ctrl+A. It is also possible to select an item by pressing Space. By doing so, the current selected row will move to next item in the list |
| • | A clock toolbar is added to main window, with possibility to add up to 5 clocks with different time zones |
| • | Added new Broker Statistics columns Buy Value % and Sell Value % |
| • | News items now opens on the same monitor as the news window. |