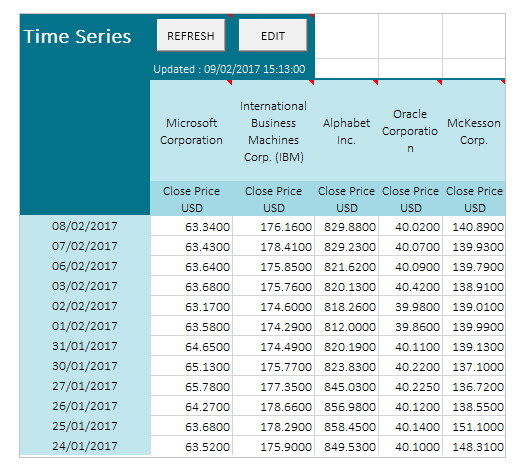
Time series is the functionality that allows you to import historical data for a list of instruments into Excel. In addition to retrieving the data, it creates a connection from your workbook to the platform that makes it easy to refresh the data when needed.
Instrument types
Available instrument types include:
•Companies
•Market indices
•Industry sector indices
•Currencies
•Bonds*
•Funds*
•Futures*
•Options*
•Stocks*
Data types
Available data types include:
•Quotes Daily
•Market capitalization
•Dividends
•Estimates FactSet
•Target Price
•Quotes Intraday*
Time series format
By default, the Time series format is a vertical descending table (most recent date at the top).

You can switch to ascending format by editing your Time series.
As you can see below, the currency can be set to Reference (reporting currency) which is the currency used by the company when reporting its financial statements:
![]()
Time series editing and updating
You can edit a Time series using the Edit button. Instruments, time period and formatting options can be modified. However, the data type cannot be modified in an existing Time series.
A Time series is a database snapshot that can become stale (out of date) when the data on the platform changes. At any time, you can trigger a refresh action –with the Refresh button – to update your data.
*only available for Infront Terminal users