What's new in Infront?
Click here to open in the terminal

Find clusters of volatility and obtain the moments of the return distribution by selecting “Return Histogram” under the “Discover” section on the right click, and the history tab in the Symbol Overview window.
Aggregate price and volume levels in all order books simultaneously. This function works for Orderbook, New Order Window, Click-Trader, and Orderbook Visualizer. To turn on this feature, go to Advanced Settings > Market Data > Orderbook and tick "Support custom tick size". To aggregate orders by level, hold shift and use mouse wheel
Click here to open in the terminal

Unearth hidden correlations in the markets by selecting multiple instruments, and selecting “Correlation Matrix” under the “Discover” section on the right click.
Click here to open in the terminal

Observe the distribution of the trades during the day, compare the last price and VWAP with respect to past trades, and even replay the trading across the day to better understand the market dynamics for that instrument. You can find this new feature in the “Symbol Overview” in the “Trades” section.
Click here to open in the terminal

The Infront Fragmentation Index provides you with a real-time measure of the fragmentation for a particular instrument. You can select between the Herfindahl-Hirschman Index, or/and the Infront Fragmentation Index. You can find it under “Trades” in the “Symbol Overview”. For more details on our methodology click here
Click here to open in the terminal

See the venues’ market share and the categories of the trades at each market place with maximum granularity.
Click here to open in the terminal

With the new Orderbook Visualizer, you are able to discover market dynamics in a graphical way, in real-time.
You can find the Orderbook Visualizer on the right-click menu, under “Discover”.
Click here to open in the terminal

Whether you are looking into commodities, or cyclical stocks, a Seasonality Matrix is a great tool to discover patterns that can lead to your next successful trade.
Right-click on the instrument you want to explore, and find “Seasonality Matrix” under the “Discover” menu.
Click here to open in the terminal

Now you can chart technical analyses over technicals. When you add a new study, you can select whether you want to apply it over the original time series, or the one derived from another technical analysis.
Improved granularity and transparency


- Standardization across all EU markets to the MMT (Market Model Typology) for post trade data as part of the increased transparency requirements included in MiFID II
- Increased granularity in reading the tape and understanding the market micro structures of trading activities.
- Display of Approved Publication Arrangement (APA) trades in real time:
- Large In Scale threshold volumes
- Standard Market Size
- Daily Transactions
- Average Value of Transactions
- Average Daily Volume
- Average Daily Turnover


- Support for displaying Systematic Internaliser quotes
- User friendly interface allowing enable/disable the display of quotes from one or several Systematic Internalisers

- Providing users with Key Investment Documents (KID) for instruments which require it
- Multi language support
- KID documents available in the Order Entry window, Right Click, and Symbol Overview
The ultimate tool for real-time portolio oversight

- Maximum integration: Portfolio Management Systems, Trading, and automatic import of Excel and CSV files
- Cross-platform real-time alerts on portfolio performance and events
- Multi-account management: easy search of client's portfolios, and overseeing of intra-day performance of multiple portfolios
- Summary of the portfolios' composition and attribution
- Real-time signals using Infront's Motion Detection algorithm
- Full oversight of the portfolio holdings
- Portfolio-specific news, research, and macroeconomic events
- Portfolio attribution and characteristics
- Fundamental analytics for the portfolio holdings
- Backtesting
- Performance measures
- New sleek and intuitive design
- New menu distribution of functionality and market data for easy access
- Improved colour themes
- New chart types: Henkin-Ashi and Origin Line
- Improved studies: Snap Line, Price volume chart

- Libraries for R and Python
- Copy code snippets directly from the terminal
- Easy retrieval of historical time series for further analysis
You can now find equity research for a specific instrument easier than ever. Whether you are looking at a chart, symbol overview, or a News Window, Equity Research will show up in a clear and acccessible way.

- New headline tags to quickly idenfity research in Charts, News Windows, and Symbol Overviews
- Open research documents directly from charts
- Filter for Research
Our world-class trading solution keeps getting better

- Fixed Gross Price order modification: Keep the original gross price of an order when changing limit price and instead adjust order volume
- Order Staging: Send multiple orders with a set of given parameters (price, volume, strategy) simultaneously to the market
- Order Staging: Import staged orders from Excel or API
From any market window, you can now obtain a graphical overview of the instruments

- Select the Heatmap tab to visualise markets, chains , or custom lists
- Define the box size based on market cap, turnover, news count, and more
- Group the boxes based on sector or segment
- Graphical and adjustable filters
For any derivatives market's Put/Call window, press the "Volatility Surface" button located on the toolbar

- Analyse put and call implied volatilities
- Dropdown to select between bid, ask, and mid implied volatility
- Real-time underlying spot price tracker
- Mouse-over with multi-axis information

- Scroll for panning in and out
- Click and rotate to obtain multiple viewing angles
- "Time ago" function to animate historical changes
- Mouse-over implied volatility hint

- Multi-select for currencies, and tabs for easy navigation
- Drop-down to select between Premium, Normal and Log-Normal Volatility, and Volatility changes
- Double click to obtain the chart of the strike or expiry series
- Mouse-over symbol overview
- Open the 3D Surface Chart

- Select scrolling speed of the click trading window
- Clear volume after sending order
- Focus Volume field after sending order
- Double click to send order
Export historic values linked to a date value in a given cell in Excel

- Mutiple viewing modes: Time consolidated, multi-contributor, and transposed
- Swaps, Forward Rate Agreements, and Deposits
- Enhanced filter
- Easy navigation across currencies and contributors through tabs
- Double click for yield/forward curves and interpolations
- RTD Excel linking
- Mouse-over intrument quick overview

- Treasury bonds and bills, inflation linked bonds, and mortgage bonds
- Drop-down to navigate across issuers
- Double click to access to the yield curve and discount factors
- RTD Excel linking

- Access the tool from any Yield/Swap/Forward Curve chart
- Discrete-to-continous curve fitting to obtain broken dates rates
- "Make your own bond" functionality: select your reference bonds and calculate the present value of your cashflows for any date by simply adding the dates and the currency amount

- Drag and drop any instrument or sequence of instruments to instantly compare them
- Hover over the maturities to obtain the Spread Matrix of the instruments you want to compare
- Automatic interpolation for missing dates
Richer in detail and improved structure

- Click on the menu to search by asset class and country
- Seamlessly integrated with the Search Bar
- More detailed navigation
- New lists available on the Search Bar
Keep track of all world's currencies in real-time.

- Type your base currency, and access to 180 exchange rates
- Easy and fast search across the list
- Link to charts and descriptions to obtain all relevant information by clicking on a currency pair
- Feed source selection menu
- Change the base currency of the reference rates by simply clicking on the "Base-Quote" button
FX Forwards window

- Select source from drop down
- Switch between forward points, forward price or dual mode
- Mouse-over hint with chart, number of days, adjusted forward date, forward price
Orderliness, automatization and more descriptive power in the Put-Call window

- New tabs grouping the options by expiry date
- Automatic calculation of the Greeks, and Implied and Historical Volatility
- Enhanced filter
- Direct access to the calculation setup and interest rate input from the toolbar
- New layouts for option trading and analysis
- Moneyness and Notional Amount
Group, expand, collapse

- Group stock lists by Sector, Subsector, Segment, Cap and more
- Grouping for Fixed Income instruments
- Supports all possible permutations
- Expand and collapse all subsections
Always up-to-date
New versions are automatically downloaded and installed
Company Desktops
The new Company Desktop introduces a comprehensive company overview covering

- Real-time market data
- Estimates
- Financial statements
Company Overview
The improved Company overview provides links to Estimates, Financial statements together with insiders and Short positions

- Estimates
- Financial statements
- Insiders and short positions
- List of international peers
Improved Charts
Higher resolution and new features

- Higher resolution: Anti-alias
- Continuous cursor: Get axis data across your workspace
- New area chart
- New period bands
Financial Statement Widget

- Income Statement
- Balance Sheet
Open Symphony in the terminal
We now have support for accessing the Symphony messaging service from the terminal.
In order to access it you need the following access in web admin: Infront - Symphony Chat Client (Public, my.symphony.com)
The Symphony secure messaging can be accessed in the Infront terminal directly from the main menu or simply by just start typing Symphony in the search field:

Share window to chat
All windows and other interesting observations made and found in an Infront terminal can be shared with your Symphony contacts by using the seamless Share to Chat feature which can be found in the tool bar menu on all windows in the terminal.

That function will immediately share a URL together with a cash tag and last change in % if the market is open for trading.
If the user on the receiving end has the Infront Terminal installed, hitting that link will open up the shared window in his Infront terminal. If the receiver is not an infront user he will be taken to the website shown below which lets him view the shared window and also sign up for a free trial of Infront.
Open company overview from chat
It is also possible to share a cashtag like $ERICB from a Symphony chat window to the Infront terminal by highlighting the cashtag and drag & drop it into the Infront terminal which then opens up a detailed company overview of that specific instrument, displayed in the image below.

Mail to Support in the menu
The Mail to Support shortcut has been made easier to find in the Main Menu.

And the Mail to support dialog has been simplified:

Share desktop from desktop right-click menu
Just like you can share a window, it is now possible to share all the windows in a desktop. Just right-click the Desktop page and select Share Desktop.

New Order symbol search
The New Order command from the Orders page of the Trading window now uses normal symbol search.
New trades blinking
New incoming trades in Trading window are now shown with a blinking color.
Support for Chromium embedded browser
Until now the terminal has used an embedded version of Microsoft's Internet Explorer in the Browser window. Now a Chromium-based embedded browser can be used instead (Chromium is based on the same technology as the Google Chrome external browser).
For now only selected web-based services will use Chromium. Over time more services and the Display | Browser command will be certified and moved to Chromium.
Pivot Points
Pivot Points is a new technical study found in the Technical menu options in Chart windows.
A pivot point is a technical analysis indicator used to determine the overall trend of the market over different time frames.
The pivot point itself is simply the average of the high, low and closing prices from the previous trading day. On the subsequent day, trading above the pivot point is thought to indicate ongoing bullish sentiment, while trading below the pivot point indicates bearish sentiment.
Yesterday's High, Low, Open, Close lines
These new studies are available in intraday charts and show horizontal lines for the previous day's High, Low, Open and Close prices, respectively.
Support RTD links for historical prices, splits and dividends
Note: A special access is needed to enable this
Search for services from Ctrl+F
The external web-service commands available in the Analyze menu are now also searchable from the Ctrl+F field
Improved VWAP filtering logic
The filtering available in the Symbol Trades view has been made smarter with regards to default logic for the Auctions and Lit market filters
Support for BankID
The terminal now supports trading logins using BankID for mobile credentials (depends on trading server support)
A faster, optimized terminal
A lot of optimization has been done to improve performance in the terminal.
- Faster workspace loading
- Faster symbol search in workspace
- Optimized user-interface
- Faster Charts
Infront's noise reduction technology
Algorithms scan through all real-time feeds in your workspace. Out of the ordinary price movements and events are displayed in the Signals widget located at the top of the toolbar.
Clicking on the widget shows a drop-down with the five most interesting movements and events. Hovering over any of the instruments will display a chart highlighting which events are interesting.

Infront's noise reduction technology based on custom lists and chains
Create your own signals widgets based off of your own custom lists (or chains) by clicking on the Create Signals Widget button in the custom list (or chain) toolbar.

Right-clicking on any created chain or custom list widget will allow you to change settings related to the widget.
This feature is only available in Infront Plus

Better Overview
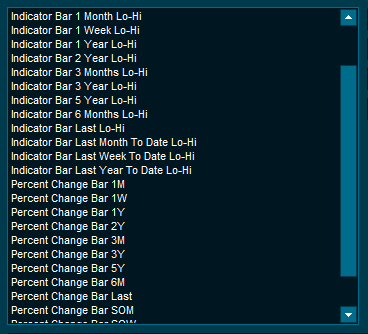
New columns available in Custom List and market windows with graphical hi/lo indicators and percent change columns with bars. In Custom List there is also a new 2 day chart column.

The columns can be added for different time periods in the Select Columns dialogue

Market windows and custom lists show smart hints
Holding your mouse over the symbol or description columns now show more information regarding the instrument including VWAP, price change today and a 2 day chart

Quick Analytics
If you have access to Infront Analytics, two new options are available from right click:Company Analytics; Quick GPRV and Quick Estimates
Estimates
Choose the estimates you want to see from the drop-down. Recommendations and target price are always available.

GPRV
Choose between International, Regional and Domestic peers lists in order to quickly compare scores. Click on the ratios around the GPRV chart to change which scores to compare

This feature is only available in Infront Plus
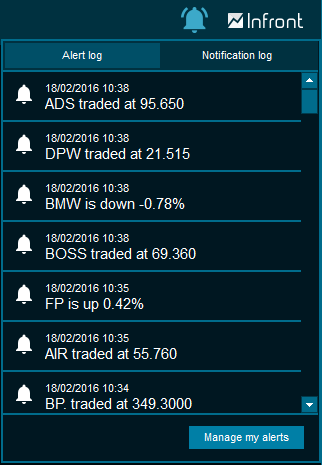
Improved Alert Log
Clicking on the alerts icon brings a drop-down menu showing you recently triggered alerts, and also historical alerts which have been triggered.

Chart improvements
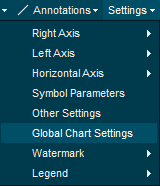
Charts are in general much faster now. Chart performance settings are easily available from the "Global Chart Settings" menu option


Set your own watermarks (background text) in the chart

Choose whether to display the ticker symbol or description in the chart


Desktop Builder
Desktop builder allows you to open predefined desktops with carefully crafted layouts designed to give the best overview of a given market. Once you have chosen a desktop, you can also choose which geographical location you wish to open (when relevant).

New Market Columns
New columns are available for adding to your custom lists and market windows
- Average True Range
- Signal
- %Change in auction
- 5 min change (available in Infront Plus)
- Percent bar and hi-lo bars (see Better Overview)
- Improved alerts
- Improved yield curves for benchmark bonds and interest rate swaps
- New market columns
- Currency conversion in charts
- Performance improvements
- Other improvements
- Cross-device alerts
- Cross-device alerts on iPhone and iPad
- Portfolio View
- Benchmark symbols
- See live market data in any currency
- Consolidated market data
- Venue statistics
- Fund improvements
- New trading features
- VWAP Calculator
- Other improvements
- Cloud List
- Light Theme
- Equity Analytics improvements
- Fund search and fund overview improvements
- Bond search and bond oveview improvements
- Click trading improvements
- Calendar revised numbers
- Improved symbol overview
- Side-by-side market window view
- Corporate Debt Module
- Click trading improvements
- New toolbar
- New main menu
- New global overview page
- Easy search and command