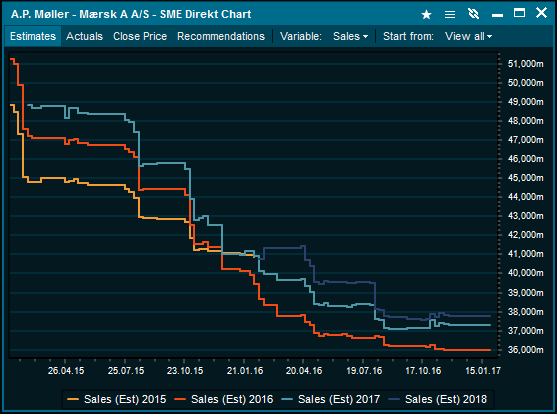
Description
SME Direkt Level 2 provides a deeper level of fundamental data on Nordic companies with results, estimates and recommendations. It contains several years of historical results and future estimates in both yearly and quarterly resolutions. It allows drill-down into statistical details per company and visual presentation of historical trends.
Requirements
•Subscription to an SME Direkt Level 2 package
How to access
•Right | click on a company or symbol and select SME Direkt Chart
SME Direkt Chart window
The SME Direkt Chart view shows a historical chart of the following variables:
•Estimate changes
Displays historical graph of the selected key ratio variable. The following variables are available:
- Sales (default)
- Gross profit
- EBITDA
- EBIT
- Net profit
- EPS
- DPS
•Actual results
Shows the actual result of the selected key ratio variable. The values are plotted as rectangular dots.
•Close price
Overlays a graph displaying the close price for the selected period.
•Recommendation history
Displays a historical view of the recommendations.
Time period
A time period may be selected to define the interval being displayed.
