Brokers
Shows active brokers who have executed trades on the selected symbol (only available for selected markets). Please note, that there are more advanced Broker Statistics available.
Example
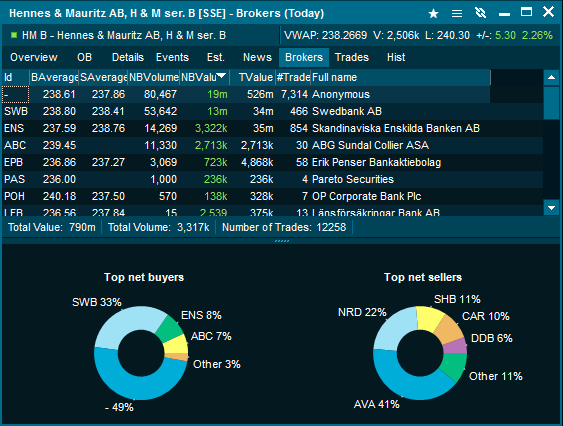
NBVolume - Net Buy Volume. Displays the number of shares bought minus the number of shares sold.
NBValue - Net Buy Value. Displays the value of shares bought minus the value of shares sold.
BAverage - The average buy price for all trades where the broker was identified as the buyer.
SAverage - The average sell price for all trades where the broker was identified as the seller.
TValue - The total value of all trades placed by the broker, regardless of whether they were buyer or seller.
Charts - The pie charts show the % distribution of top net buyers and top net sellers.
There is a lot of interesting information to analyze in the brokers tab. Amongst other things, it can give you an idea of the distribution of buying and selling activity between international and local exchange members.
|


