Fund overview


Fund overview |
|
|
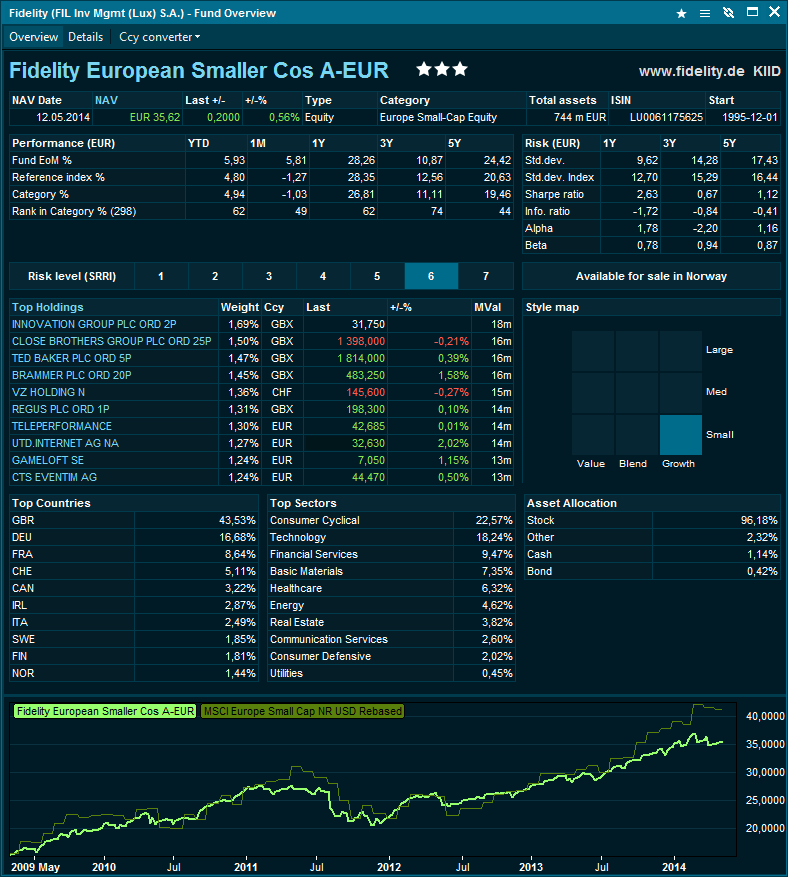
Fund overview provides important quantitative and qualitative fund information in a way that is easy to analyze and compare. Overview window
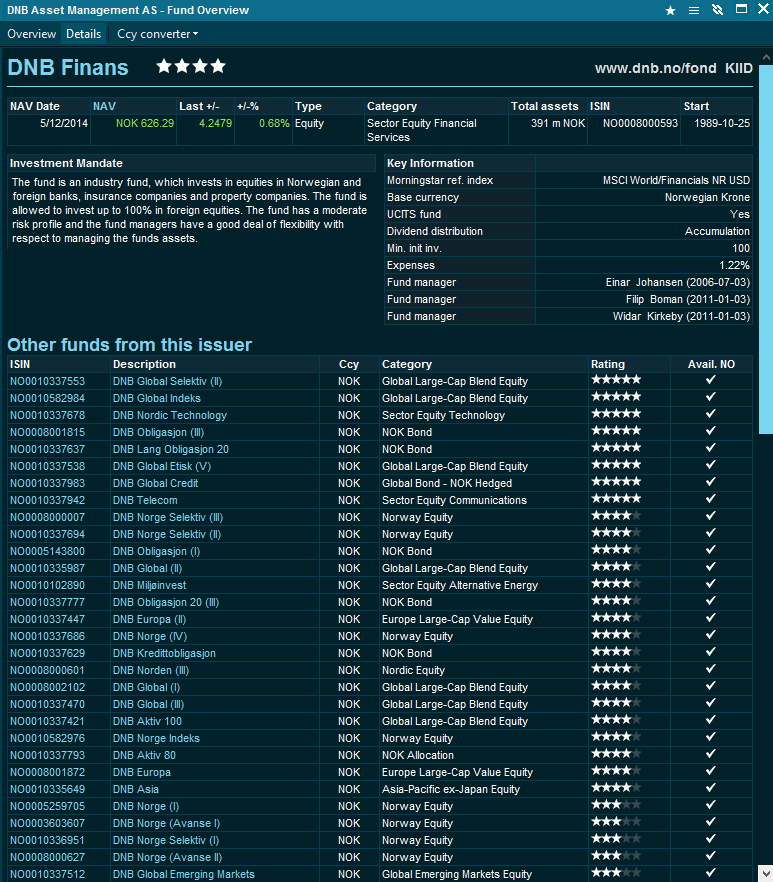
KIID - Key Investor Information Document - is available for the funds. There are several fund groups that do not have KIID documentation, for example, UCITS funds. NAV Date - date of the last updated NAV value NAV - last Net Asset Value. Clicking on 'NAV' heading opens the historical NAV overview Type - type of fund based on asset classes Category - official Morningstar categories. Each fund is assigned to a unique category that the fund is compared to in terms of its performance and risk indicators. Start - start date of the fund Performance table displays end of month performance for the fund, reference index and category the fund belongs to. Performance values can be converted to different currencies by using the 'Ccy converter'. Rank in category % - percentile rank of the fund in a category Risk table provides an overview of the fund's risk profile. Risk values are always in the subscription currency of the fund (NAV currency) Risk level (SRRI) - synthetic risk reward indicator - indicates the risk level of the fund. 1 meaning low risk, 7 meaning high risk. The risk score is based on historic data and should be viewed as an indicator only. Available for sale in <Home country> - home country is defined in the Tools --> Preferences --> Regional. Top Holdings - displays the Top 10 holdings of the fund, their weighting, currency and market prices. Positive market value depicts a long position in a holding, a negative value depicts a short position in a holding. Clicking on the heading 'Top Holdings' opens a composite window with all the respective holdings and market data: User can also click on each holding to navigate to an overview of each instrument. For listed companies, a Company overview is opened containing fundamental data, peer analysis, consensus estimates, etc. Style map - Morningstar style map for equities provides information regarding the investment style of the fund. 'Small' and 'Growth' values imply that the fund invests in small cap companies experiencing high growth. Top countries - countries that the fund is invested to and their weight. Country is the incorporation coutnry of the companies the fund is invested in. Top sectors - sectors that the fund is invested in. In some cases, the total might not add up to 100%. This is due to the fact that not all funds report their holdings fully. Asset allocation - provides information about funds' holdings in different asset classes. Asset allocation can be over 100% - this is due to short/long positions in the funds' portfolio Fund graph - shows historical performance of the fund for the past 5 years. The Morningstar reference index is also displayed in the graph after being re-based. Clicking on a graph will open advanced charting functionality allowing the user to perform further analysis. Details window Details window provides important qualitative information about the fund.
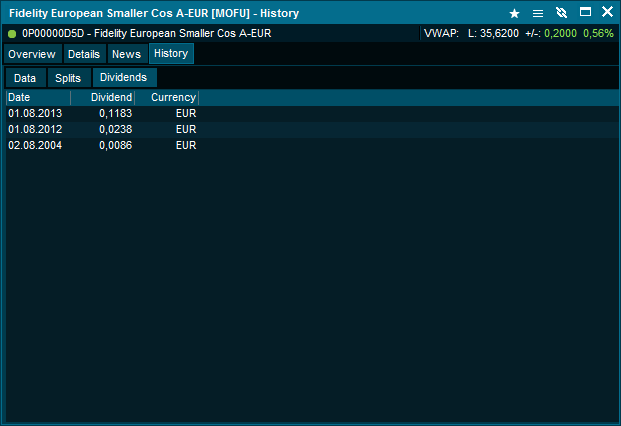
Dividend distribution - Accumulation for funds that reinvest dividends back to the fund, Income for the funds that pay dividends out. For Income funds, user can click on 'Income' and get an overview of all the previously paid out dividends:
Expenses - total expenses Other funds from this issuer table shows other funds from the chosen issuer in the same currency as the current fund. User can open a Fund Overview for funds in the list by double-clicking on a fund. User can also click on the heading of the table which will then open the search window where the user can further screen and adjust the search filters. |