Chart Annotation


Chart Annotation |
|
|
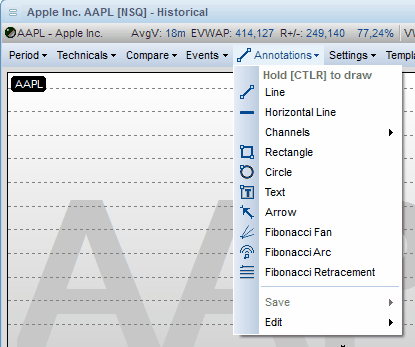
Annotations can be added on top of any line, bar or candlestick chart. There is no limit to the number of annotations that can be added to a chart. All annotations can be saved from the Annotations drop down menu to the main symbol. The annotation tools are found in the annotation drop down at the top of the chart.
The highlighted picture on the toolbar shows the currently selected annotation tool, which are the one that will be drawn. Click on the toolbar button to view the full annotation toolbar.
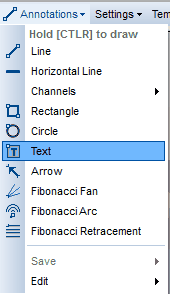
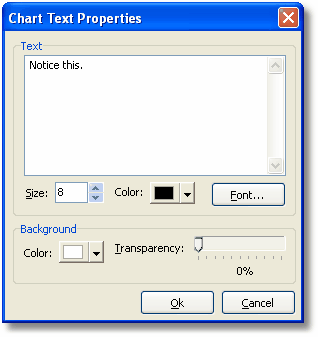
In addition to the annotation tools there is a select tool which will either select a graph (click), edit a graph (double click) or zoom (click and drag on the chart) when used. When an annotation tool is selected, hold down the control key in order to draw. Then click on the starting point for the annotation in the chart. Still holding both the control key and left mouse button down, drag the mouse to the end point for the annotation and release the left mouse button (and the control key). The annotation will now draw itself in the selected coordinates in the chart. For all annotation tools it is also possible to move it to another position or to change the start or end position. This is done by click and hold the left mouse button on the annotation tools grip handle, a black box. There are two modes of drawing trendlines available in the application. Either by holding down ctrl or simply by drawing freely, to switch between the two modes go to Tools | Preferences |Charts, then check the box for "Use annotation zoom mode" Shortcuts Zoom: Ctrl+Home Select: Ctrl+End TIP: Hold down the CONTROL key while pressing UP or DOWN key to cycle through all items on the annotation toolbar LineTo draw a line (trend line), select it from the annotation tool bar, click and hold the left mouse button in the chart and drag to draw the new line. The selected trend line will be indicated with a selection handle at each end. Click and drag a selection handle to change the angle or the length of the line. A trend line cannot be manually drawn past the last time point in the chart, but it is possible to right click and select Extend Future. There is also a separate option called Extend Past that extends the line backwards in time. The short cut menu (also available from the toolbar) contains commands to duplicate, delete and change the color and widths of the selected (or all) lines. This behaviour is also applies to horizontal parallel lines, vertical parallel lines, rectangle, circle and arrow. Channels - Parallel linesFirst draw a line in the same way as the single line. When finished a second parallel line will be added, which will follow the base line in any direction on the chart. Channels - Vertical & Horizontal Parallel linesThese two parallel lines modes works only either vertically or horizontally on the chart.TextA text box can be added anywhere in the chart. It is possible to change the properties of the font and the box from the text property dialog.
This dialog is displayed when adding a new text annotation to the chart, or by right click on an existing one. All annotation tools has a start and an end point except for text. To add a text box just single click on the chart, which will be the top left corner of the box. The background color can be set to a % transparency blending with the chart itself. Fibonacci arcA charting technique consisting of three curved lines that are drawn for the purpose of anticipating key support and resistance levels, and areas of ranging. Fibonacci arcs are created by first drawing a trend line between two points (usually the high and low in a given period), and then by drawing three curves that intersect this trend line at the key Fibonacci levels of 38.2%, 50% and 61.8%. Transaction decisions are made when the price of the asset crosses through these key levels. When the chart overlay mode is in “zoom” or another drawing mode, the Fibonacci controlling trend line is not visible. If the chart overlay mode is “select”, the controlling trend line is visible and it is possible to change the position of the arc. Fibonacci fanFibonacci fan is a charting technique consisting of three diagonal lines that use Fibonacci ratios to help identify key levels of support and resistance. Fibonacci fans are created by first drawing a trend line through two points (usually the high and low in a given period), and then by dividing the vertical distance between the two points by the key Fibonacci ratios of 38.2%, 50% and 61.8%. The result of these divisions each represents a point within the vertical distance. The three 'fan' lines are then created by drawing a line from the leftmost point to each of the three representing a Fibonacci ratio. As for the arc, the trend line is not visible when the chart mode is in zoom mode or another draw mode. Fibonacci retracementA term used in technical analysis that refers to the likelihood that a financial asset's price will retrace a large portion of an original move and find support or resistance at the key Fibonacci levels before it continues in the original direction. These levels are created by drawing a trend line between two extreme points and then dividing the vertical distance by the key Fibonacci ratios of 23.6%, 38.2%, 50%, 61.8% and 100%.Fibonacci propertiesAll the three Fibonacci lines have a property dialog where it is possible to alter the default settings. The property dialog is opened by selecting the Fibonacci object, right click and then select “Properties…” from the popup dialog. The most important thing to notice is the possibility to change the color and width for the levels. |