Composite Window
Chains
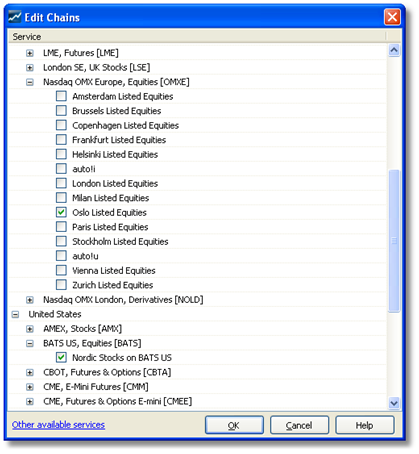
In the Chains page of a Composite window, you can now select and display multiple chains from any number of markets. Press the Edit button on the toolbar to open a dialog where you can check the chains you want to include.
Market Window
New summary bar
The market window and composite window now includes a new summary bar displaying the following fields:
•Total number of symbols •Change bar showing the distribution of positive/unchanged/negative changes from the last price. •Tick bar showing the distribution of positive/unchanged/negative changes in the last trade. •Total Market Cap. This field is only shown when all the symbols in the list have the same currency.

Tip: you can turn the summary bar on/off by pressing F9
Show underlying values for Option feeds
You can now view the Bid, Ask and Last prices for the selected underlying symbol in the toolbar on the Quotes and Put / Call tabs.

Tip: You can double click the underlying panel to open an Overview window for the underlying symbol.
New Option Feed Filters
Several new filters have been implemented for option feeds:
•Expiry filters
You can now filter by expiry dates. By default the first two expiries are selected. •At the money (full option feeds only) •Call in the money (full option feeds only) •Put in the money (full option feeds only) 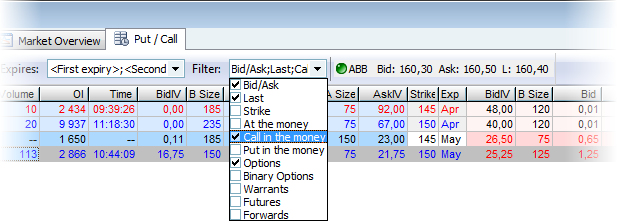
User interface settings for Put/Call
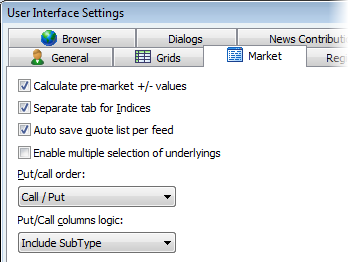
It is now possible to select and view sub type as a column in the Put/Call page. This can be switched on or off in the Market page of the Tools | User Interface Settings dialog.
You can also set the Put/Call order according to your preference.
List tab
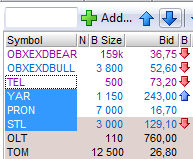
You can now select a block of symbols and move them up/down with the arrow buttons or pressing <ctrl>+Up / <ctrl>+Down.
Indices tab
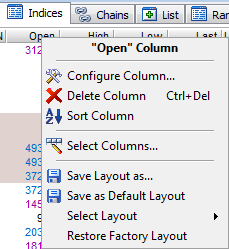
The indices tab has now a separate layout which by default excludes bid, ask and turnover columns. A default column layout can be saved for this page only.
New Recommendation Bar columns
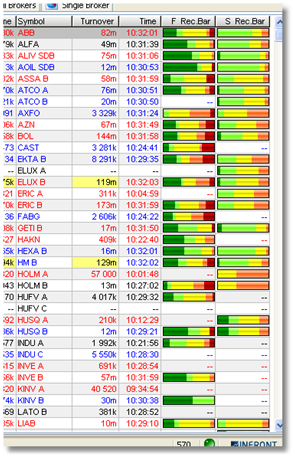
Thre are now two new columns available; Factset Recommendation Bar and SME Direkt Recommendation Bar.
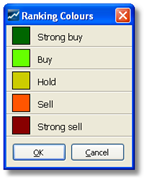
The recommendation colors (for all windows that displays recommendation bar) are configurable, accessible from right-click, Properties | Recommendation colors.
Editable Broker Statistics columns
The columns in the All Brokers and Single Brokers tabs can now be edited and saved.
Symbol window
Trades tab
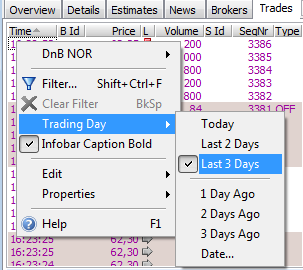
The trades tab on the symbol window now allows you to see trades for up to the last three trading days.
Improved VWAP calculation logic
The VWAP calculation logic has been modified to include new trades if the selected range includes the first row.
News tab
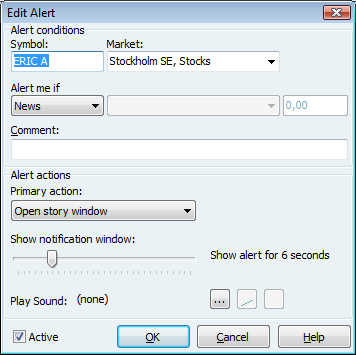
The news tab now includes an alert button on the toolbar to add a news alert for the symbol.

If a news alert already exists for the symbol, clicking he button will open the alert window so that the existing alert can be modified or deleted.
Brokers tab
The columns in the Brokers tab can now be edited and saved.
News window
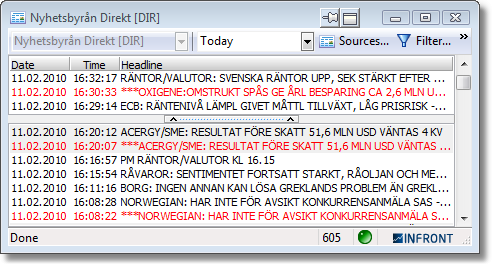
The logic has now been rewritten for the news window so that you can scroll the window without changing the focused line. The window will display the access type in the window caption (if selecting single feed).
Main window
The search edit has been improved with incremental search, displaying a list of matching symbols that have a ticker name starting with the typed text.
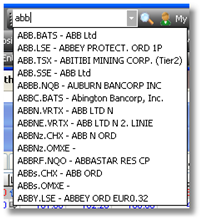
Selecting a symbol in the list will display it in a new Overview window.
Broker Stats
There are a lot of improvements in the broker statistics window.

All main controls have been added to a new single toolbar. The report type (All Brokers, Single Broker or Single Symbol) can be selected in a drop down menu, along with the display type (grid, pie chart, bar chart and timeline chart). Further there is a new dynamic selection drop down menu, which also includes the new top 5/bottom 5 dynamic selection choice.
Columns Layout
The standard edit layout context menu has been added to the broker statistic grids, including the possibility to save, save as default and restore factory layout choices. Also, there are new standard layouts for "All Brokers"; turnover, buy, sell and net.
Broker statistic charts
There are a number of common changes for all charts. The legend position can be changed from the new setup dialog:
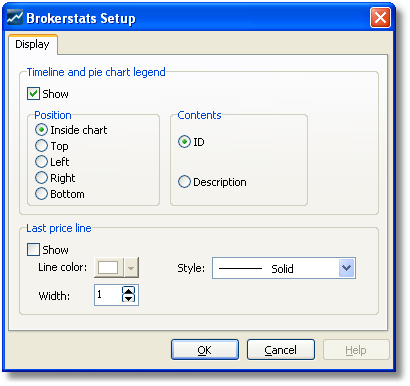
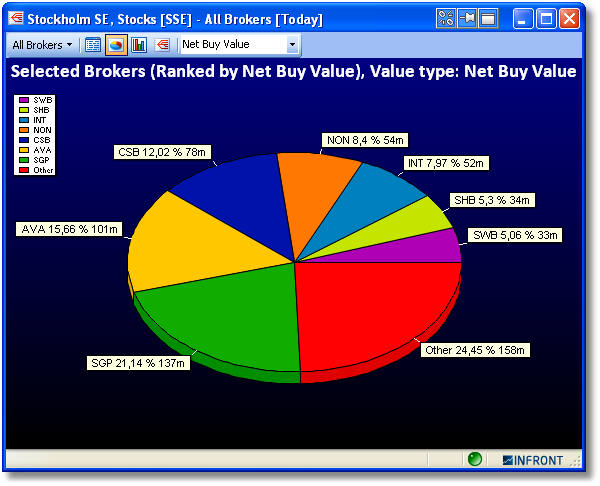
Legend can either display the symbol ticker id or the description. Background color and chart fonts can be changed from the standard dialogs accessible from the context menu. The title text has been updated to better reflect what is currently charted.
Ranking colors
The colors used in the charts are now taken from a standard ranking color setup. These colors can be changed from the new dialog, accessible in the context menu choice "Ranking colors". The selection made here is a global list of colors for all broker statistic charts in the application.
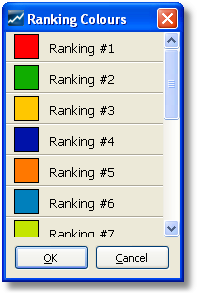
Bar chart
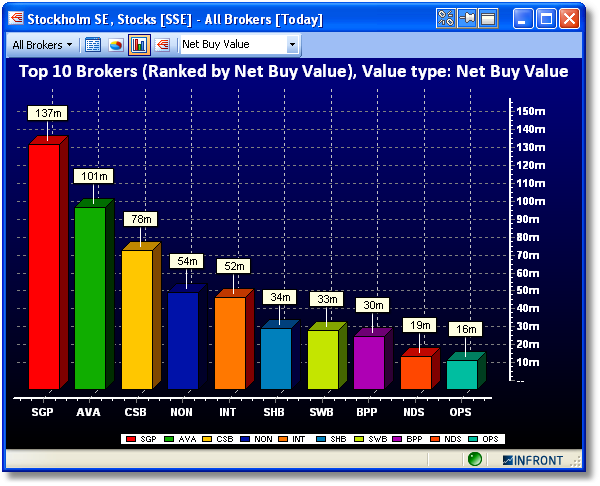
A new broker statistic chart that will display the top 10 brokers or symbols according to current report type and selected value.
Timeline chart
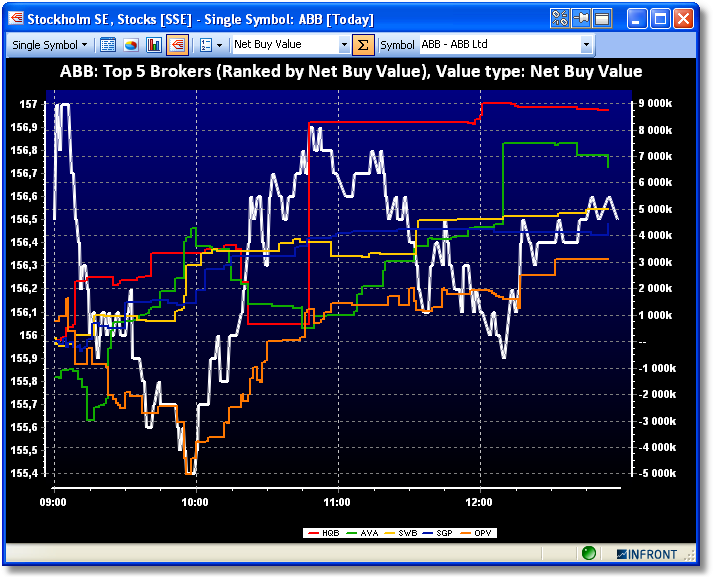
When using the Single Symbol report type, it is possible to add a last price line in the timeline chart. The line can be added and configured through the setup dialog. All lines widths can be changed from the context menu choice "Lines width".
Trade Ticker
The horizontal and vertical trade tickers now includes an optional feed column.
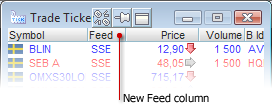
New Orderbook Features
Combined orderbook (MBLfromMBO)
In earlier versions (4.7) you could display the normal Market By Level (MBL) orderbook that shows orders accumulated into unique price levels.
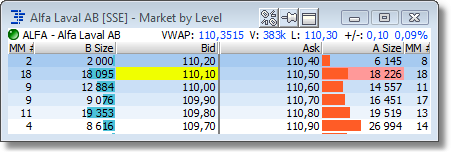
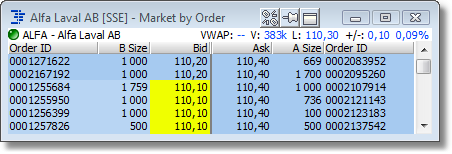
The Market By Order (MBO) orderbook shows one line for each order, possibly showing multiple lines with the same price.
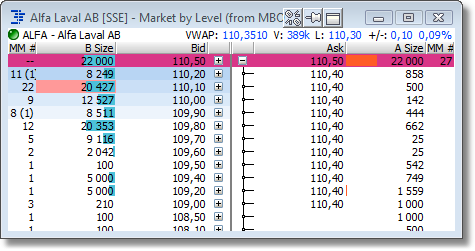
New in this version is that the MBL orderbook that the clients accumulates from the MBO data supports expansion columns with a [+] icon to expand any level into the separate orders that make up that level.
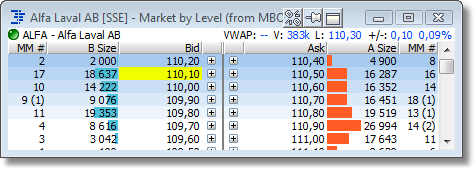
Click the [+] once to expand the level.
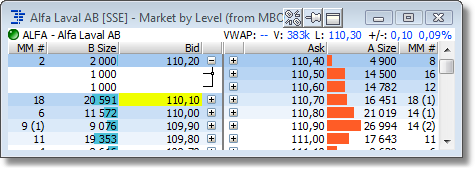
Click the [-] again to collapse the level. The expansion follows the price as the number of levels change. Note, you can limit the number of MBO orders to expand by default in the visual preferences in the orderbook setup dialog.
Notice:
- MBO orders normally have the same price as the level price, so this is not shown to reduce the clutter and repetition
- When there is a NOII level (more below), the MBO order price may differ from the level price. In this case, the MBO price is shown
- For some MBO orders the server is able to deduce what Broker-id it belongs to (for partially executed orders, the ID is taken from the stream of trades).
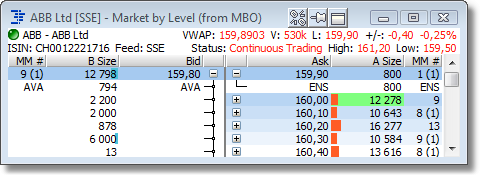
For instance in the screenshot above, we can see that the first order in the Bid queue is from the broker AVA (Volume 794, Price 159,80) and the top Ask level is from the broker ENS.
Display Member firm orders in orderbook
A brokerage house typically has a large number of active orders in the market on a number of different instruments at any given time. Infront has created a server component (that needs to be installed on-site) and client support to show these orders in all open orderbooks in the client. A user in the brokerage house may be given access to all or a subset of the types of orders.
With the server in place and the right credentials assigned to the user, the client application will indicate these orders by marking them with a special color (in much the same way as the users own orders can be indicated today). In addition to the coloring in the Price column, the MM# column and the Price column will show the ID associated with the order (for instance the broker's name or initials).
Support for Net Open Imbalance Indicator (NOII)
During the pre-opening, the orderbooks of many instruments will typically cross. This indicates that there is an imbalance in the market and that a number of orders will auto-match during the opening call. The exchange now sends out the dynamically calculated NOII price and volume during the per-opening phase.
To indicate that this NOII level is special it is colored in a different background color.
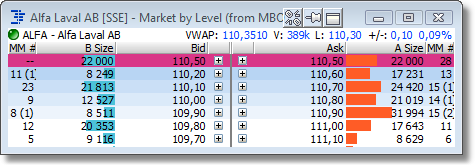
If you expand the NOII level you may find orders that differ (is better) than the NOII level price.
Consolidated Orderbook
The Consolidated Orderbook now has a setup option to show the +/- column as a real value, a percentage or both.

Chart
Order entry lines
There are four new price lines available from the Add Study menu choice in the context menu. It is now possible to add a graph for orders and trades that are currently active for the selected symbol. The chart will plot dots which reflects time and price for buy/sell orders and buy/sell trades.
New studies: relative return and relative strength
There are two new compare studies available in the context menu.
Relative return: select "<New> indexed to 0 (percent)" in the context menu under "Add Compare Study". Select a symbol in the dialog in order to compare them in percent. The formula used is <SymbolA>% - <SymbolB>% where symbol a is the current LC.
Relative strength: select "Ticker RS <New>" in the context menu. Select a symbol in the dialog in order to compare the two symbols. It is calculated dividing the price performance of a stock by the price performance of an appropriate index for the same time period.
Transparent fill
When selecting the fill line style in the graph parameters dialog, there will be a new choice to set the fill transparent in the Preferences page:
 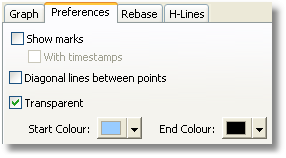
Buy setting a start and end color, the graph will be filled with a gradient.
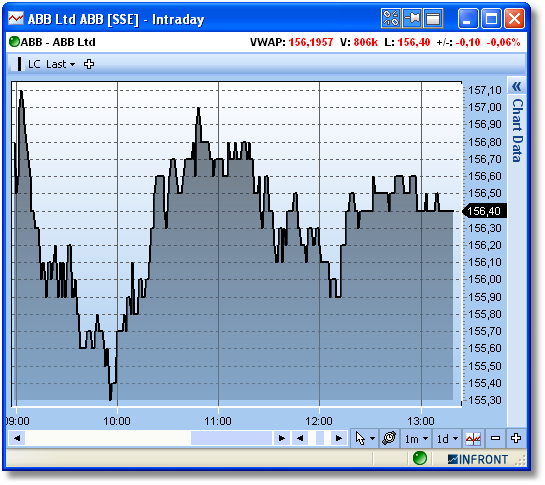
Bar chart
In the bar chart toolbar, there is a new drop down called Sort which contains all the available field types. By selecting a field type in the list, the chart will sort on this selection while graphing the values from the original selected field type.
Order entry
Find trades
This is a new window where it is possible to search for member firm trades in the back office. The window is accessed from the context menu in order status window. The window requires a user access.
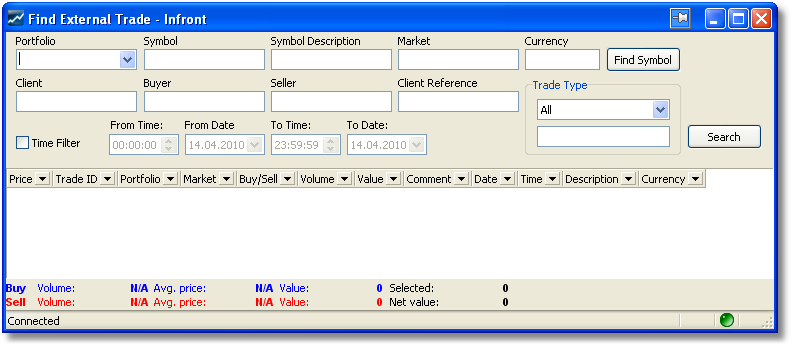
It is possible to add a range of search criteria's in the input boxes. Click on "Find Symbol" to open a symbol selection dialog in order to find a specific symbol. The search fields will automatically be updated with values from the selected symbol. Click on "Time Filter" in order to narrow down the time span for trades. Please remember to fill all four values, they will all be used as a filter when searching for a trade.
Accumulated Trades
There is a new accumulation filter called Order ID in the Accumulated Trades page of the Order Status window. Using this accumulation filter, it is possible to see one line for each unique combination of symbol and Order ID. There is also a new Order ID column.
Portfolio
The Portfolio page of the Order Status window now has support for three new columns called Overnight Volume, Bought Today Volume and Sold Today Volume. They only contain values for servers that support these values.
Option Calculation setup
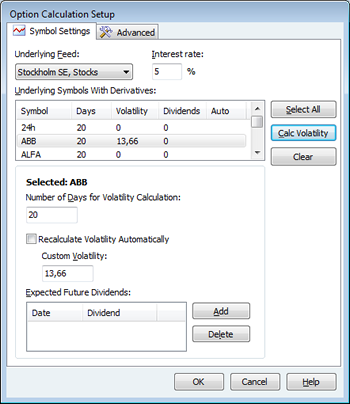
The option calculation setup dialog has been redesigned for a more fluent user interaction.
There is also a new option to have the Volatility for one or more instruments to be recalculated automatically when the application is started.
Click Trading
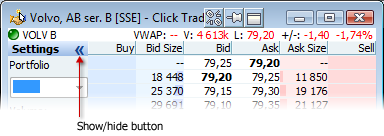
The Click trading window now includes a button to show/hide the settings panel.
Miscellaneous improvements
New alert type in Alert Monitor
The Alert Monitor now includes a new News alert type that is triggered when a news item i received for the specified symbol.
Open Screen toolbar button
There is now a new Open Screen... button on the standard toolbar to open a new screen.

New button to create desktop
There is now a new button on the desktop tab bar that simplifies creation of new desktops.

Improved Mail To Support
The Mail To Support option on the Help menu now includes a Save as button, allowing users who do not have a MAPI compliant mail client send support information.
| 


