Chart Overlays


|
Chart Overlays |
|
|
Chart overlays is a feature for storing a set of chart annotations to a file. A chart annotation is a trend line, text, arrow or other figures added on top of any line, bar or candlestick chart. An overlay is connected to the main symbol in the chart, and there can be many overlays for that symbol. All operations for an overlay is executed from the chart short cut menu "Overlays".
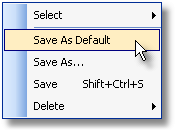
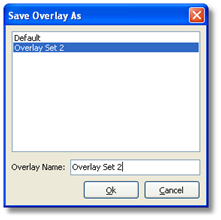
It is important to remember that overlays are not automatically stored along with the workspace. Because of this, overlays can be added to a chart regardless of which workspace is currently used. Save As Default The default overlay for a symbol is automatically loaded when a new chart is created, or the symbol is changed in the current chart. If no default overlay is present, no overlay is loaded. Save As... In addition to the default overlay, a number of named overlays can be stored for a symbol. The user will then have the option to change between the overlays stored for the current symbol. Note that saving the overlay will update all other charts displaying the same symbol and the same overlay.
Select When more than one overlay is stored for a symbol, it is possible to select between them from the “Select” sub menu. Delete Shows a list of all overlays stored for the current symbol. Select one of the overlays in the list in order to delete it. |