Infinancials fundamental data


Infinancials fundamental data |
|
|
Description Infinancials provides fundamental data on more than 61.000 companies world wide. Data Content per company:
How to access
Description The Infinancials Platform helps finance professionals analyze and compare listed companies. It provides easy access to company data, as well as various analytics and tools. This document is intended to provide an overview of the data content and the capabilities available on the platform.
Infinancials delivers comprehensive and high-quality data on worldwide listed companies. Standardized financials ensure consistent calculations across markets and industries, therefore full comparability across company peers.
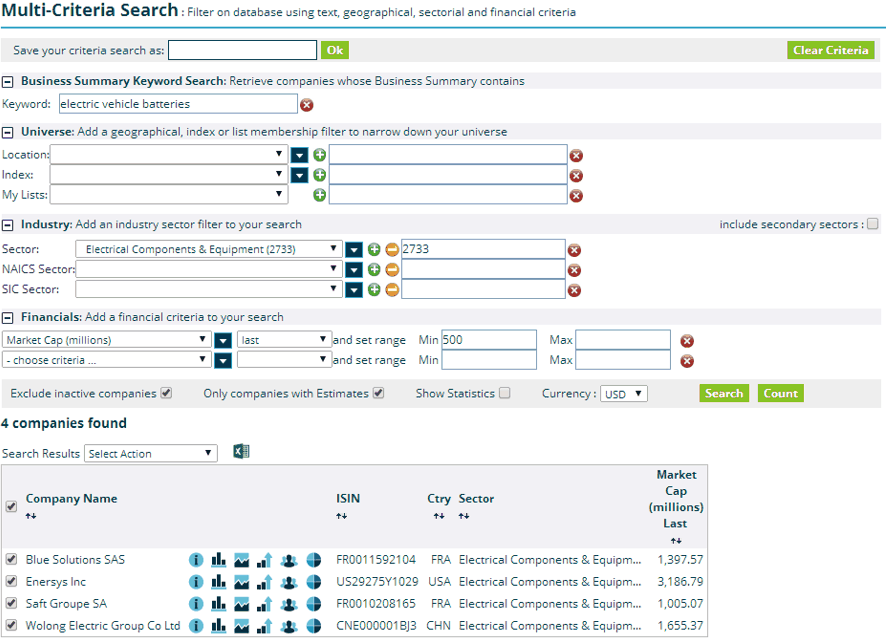
Screener / Multi-Criteria Search
The Multi-Criteria Search tool allows users to filter the database according to a set of user-defined criteria. It is useful for a variety of purposes, such as finding the best investment opportunities, or company peers in a specific business sector. Key features of the Multi-Criteria Search tool include: Keyword Search: identify comparable companies searching for keywords in their business summary. Universe Filters: narrow down your search results by using filter options on location, index, sector or list. Financial Criteria: combine up to 5 financial criteria from a list of 100+ available criteria. Analysis Options: use the multiple options available to analyze the search results. Saved Searches: save your search queries for future use.
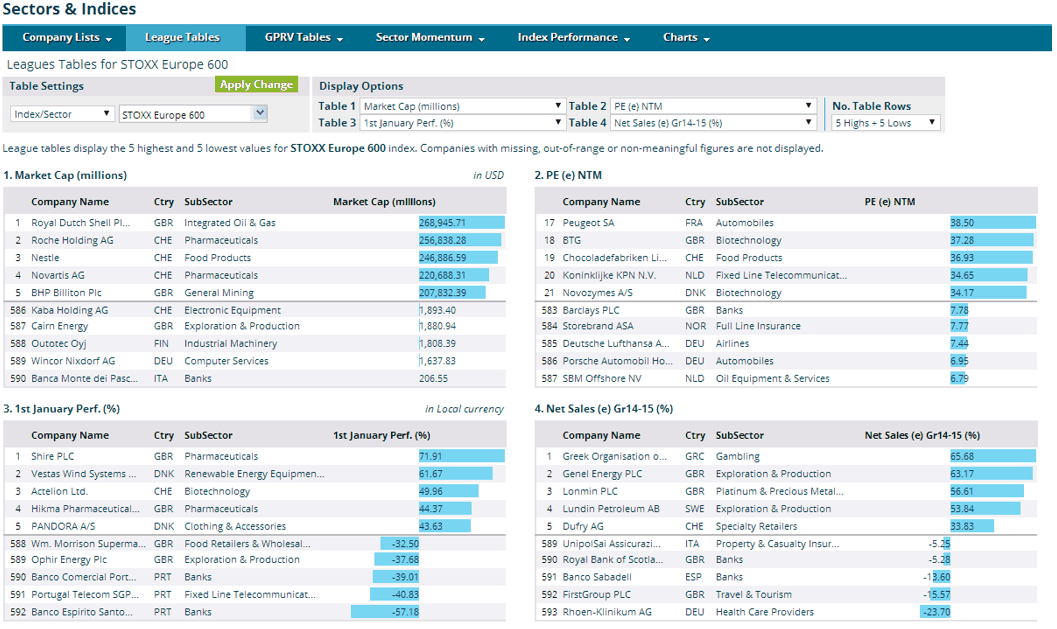
League Tables
An Infinancials league table is a list of companies, belonging to an index, a sector index or a personal list, ranked according to a financial criterion. Such tables are useful for instance to analyze an equity market across industry sectors, or to check the leaders and laggards of any company list for any indicator.
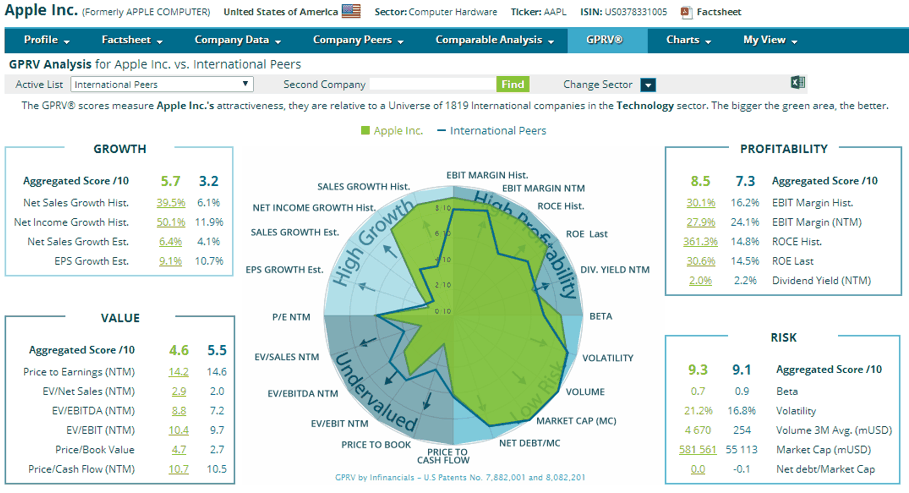
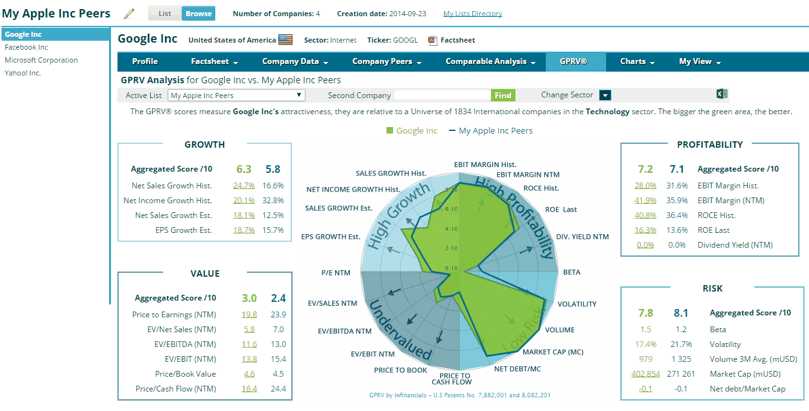
GPRV Chart
GPRV® is a patented graphical tool for assessing the relative value of listed stocks using fundamental analysis. It provides a comprehensive view of a stock’s attractiveness through 4 categories: growth, profitability, risk-free, and value. The selected company can be easily benchmarked against any other company or list of comparables.
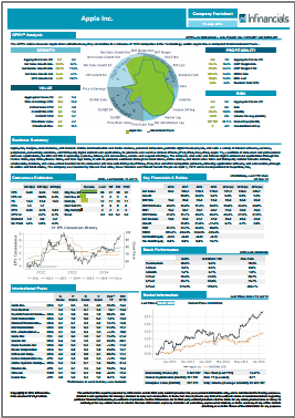
Factsheet The Infinancials Factsheet summarizes all key information about a company and comparable companies into an easy-to-read 1-page PDF report downloadable in one click.
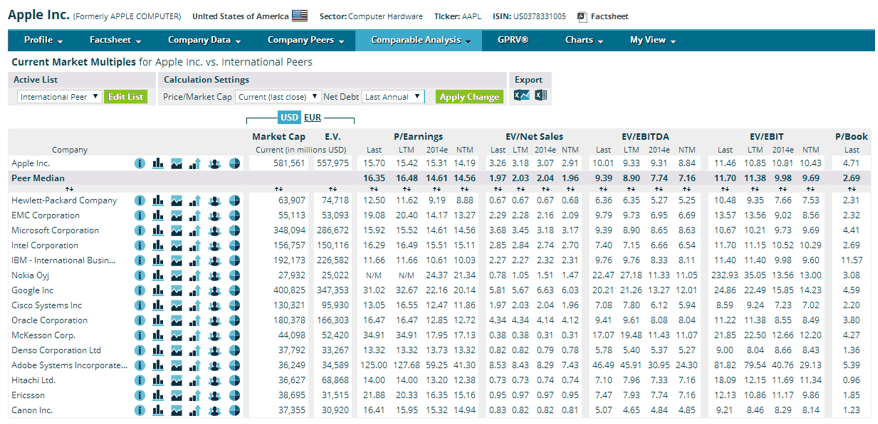
Comparable Company Analysis Tables Comparable company analysis consists in comparing a particular company to its competitors (aka peer group), with the assumption that comparable companies have similar financial ratios and valuation multiples. The comparable analysis tables available in Infinancials are an effective way to easily and quickly compare companies side-by-side, using either predefined or user-defined lists of comparables.
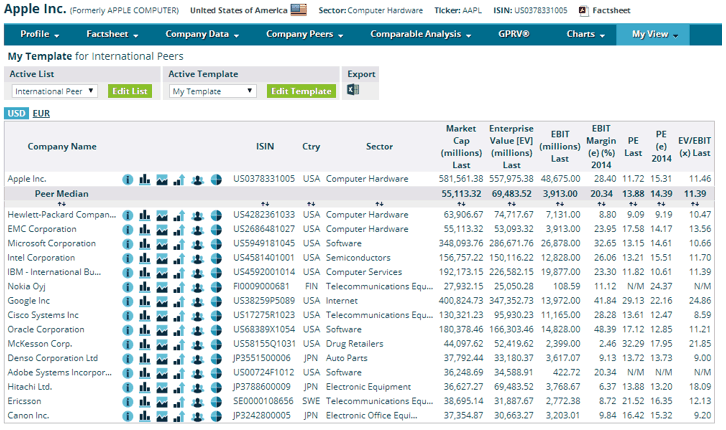
My view With My View, users can create custom comparable analysis tables directly on the web as they would do in Excel. Up to 10 data items can be chosen among a list of 100+ fields. The column selection is saved as a template, and the saved template can then be used to display any list of comparables.
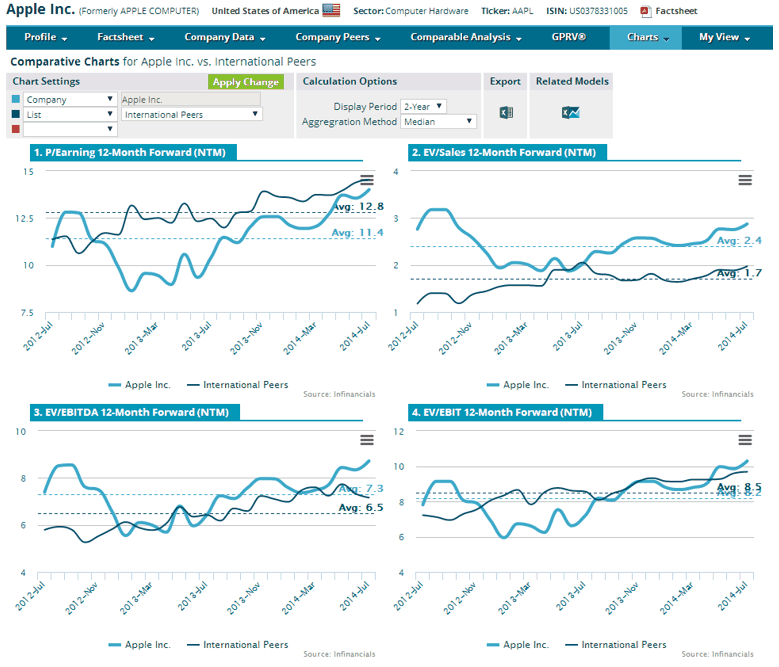
Comparative Charts
Chart views provide users with an effective means to analyze a company's financial performance over a period of time, and when applicable compare it against the performance of another company, a peer group, or a market index. Available charts include:
Fundamentals: historical and forecast charts for 10 fundamental criteria. Estimates: historical estimates charts for 7 consensus items. Multiples: comparative multiples charts (company, market index, industry sector, personal list). Ratios: comparative ratios charts (company, personal list). Quotes: rebased quotes chart (company, personal list). Regression Analysis: regression analysis chart (company, personal list).
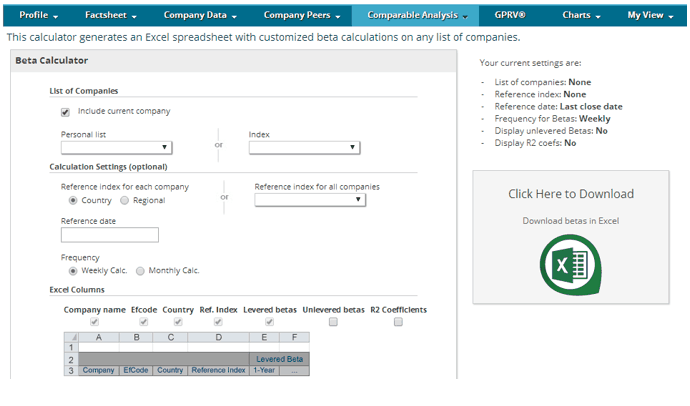
Excel Calculators Excel Calculators offer additional flexibility and functionality for beta and stock price performance calculations by allowing users to tailor predefined calculations according to their own needs. Input parameters are entered on a dedicated web page and, after computation, the results are automatically downloaded as an Excel spreadsheet.
Peer Tracker Predefined lists of comparables are handy but it is sometimes useful to edit them to add a missing company, or to refine them focusing on a specific industry sector. The Peer Tracker tool enables this in just a few clicks.
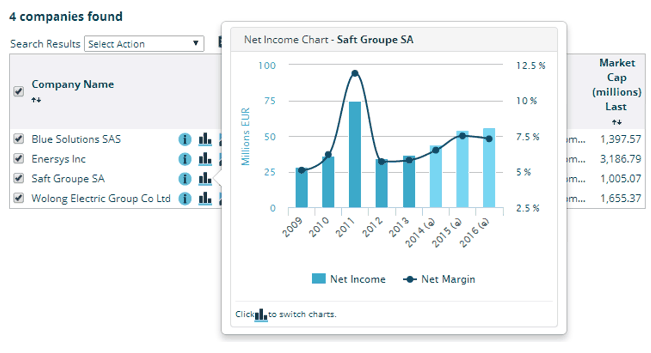
Snapshot Widgets When working with company lists, a series of small widget icons are always displayed next to each company name. When hovering the mouse on any such icon, a widget pops up showing key information about the company, helping users to get a quick understanding of its activity and its financial performance.
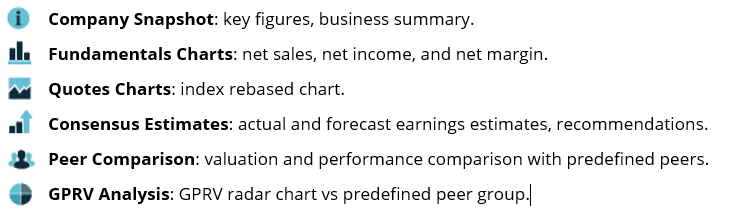
Widget Icons:
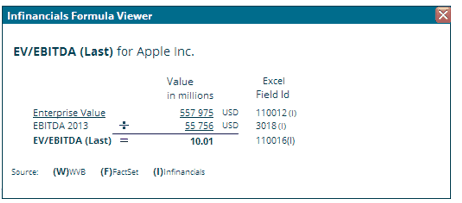
Data Calculation Transparency Infinancials provides full transparency on the calculation formula for most analytics.
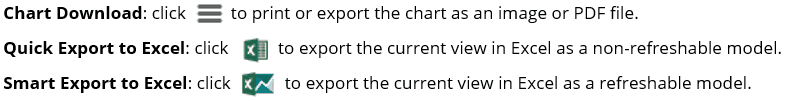
Data Export The data content displayed on web views often needs to be reused in Excel or in other environments. That is why a number of productivity tools have been developed for efficient data sharing. Such tools include:
The Smart Export feature requires the Infinancials Excel add-in (available only with Infront Plus).
List Analysis / Browse Mode Infinancials is traditionally used with an active company and a predefined or personalized peer group. In some cases, e.g. after a screening, it is useful to use the Browse mode in My Lists to enable a quick analysis of each company within the selected list.
Other Features Infinancials user-friendly interface includes many other features simplifying company analysis:
Financial Glossary: definition of financial terms and calculations. User Currency: automatic conversion of financial figures in the user-defined currency. Peer Comparison: one-click peer group selection in comparative views. Calculation Settings: options to customize the calculation of analytics such as EV or beta.
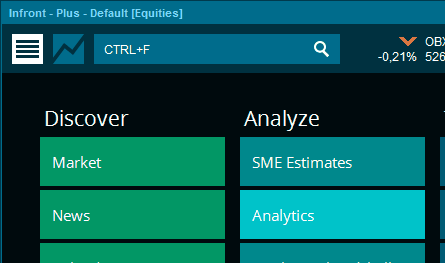
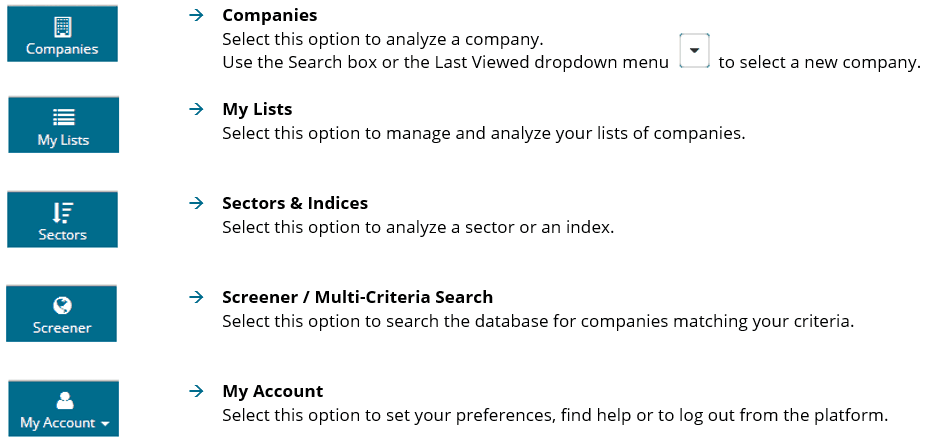
Top Navigation Bar The Top Navigation Bar is the large blue bar located at the top of each page. It contains several buttons allowing the user to switch to another usage mode. The current mode is highlighted in light blue.
Home The Home page is displayed after logging in, or when selecting the ‘Home / Help’ menu option in My Account. It is the gateway to Infinancials content and capabilities. It addresses the needs of both beginners who want to explore the main features of the product, and advanced users looking for specific information such as news about platform updates or ready-to-use Excel models. The following content is available from the Home page:
Key Capabilities: access to key capabilities (Company Data, Peers, Comp Tables, GPRV, Factsheet). Learning Center: tips and tutorials on using Infinancials. Product Downloads: Excel add-in and ready-to-use model library (available only with Infront Plus). Customer Service: customer support contact details and news about platform updates.
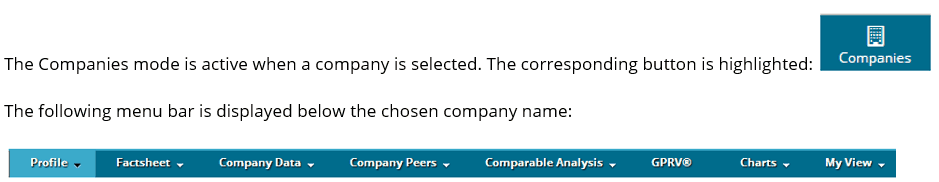
Companies
Menu options include: Profile: company snapshot and general information such as business summary. Factsheet: customizable report in PDF format. Company Data: price-related data, financial statements, earnings estimates. Company Peers: predefined peer groups, peer tracker tool to search for company peers. Comparable Analysis: market multiples, financial ratios, beta, price performance. GPRV: innovative and patented visual tool for assessing the relative attractiveness of a company. Charts: historical and comparative charts on quotes, company financials, ratios and multiples. My View: user-defined comparative data tables.
My List
Menu options include:
Edit Active List: addition or deletion of companies in the list. Comparable Analysis: market multiples, financial ratios, beta, price performance. Charts: historical and comparative charts on quotes, company financials, ratios and multiples. My View: user-defined comparative data tables.
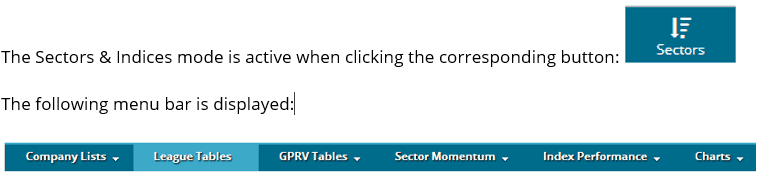
Sector & Indices
Menu options include:
Company Lists: company coverage available as country, index, or sector lists. League Tables: company lists (market index, industry sector, personal list) ranked on 100+ criteria. GPRV Tables: GPRV aggregate tables for sectors and indices. Sector Momentum: momentum-focused charts related to industry sectors. Index Performance: index performance tables. Charts: historical and comparative charts on multiples for sectors and indices.
Screener / Multi-Criteria Search
See page 2 for a description of the Screener / Multi-Criteria Search tool.
My Account
Menu options include: My Subscription: details about your Infinancials user account. My Settings: user preferences for default display options, user currency and factsheet settings. Home / Help: link to the Home page. Logout: disconnect from the platform.
|