Fund overview


Fund overview |
|
|
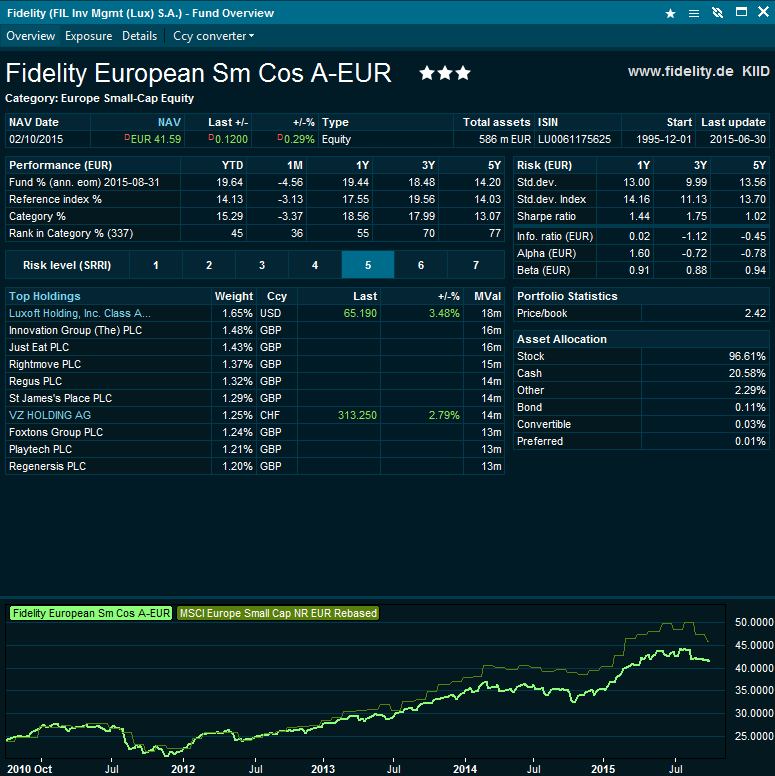
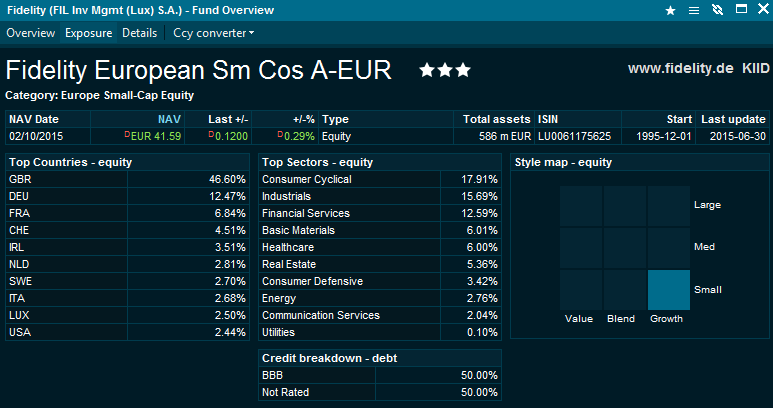
The fund overview page provides comprehensive data on both quantitative and qualitative levels for funds. The data is delivered by Morningstar and covers more than 160 000 unique funds on global basis. Overview window
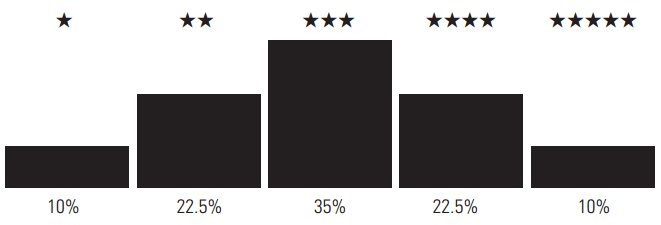
KIID - Key Investor Information Document, a mandatory document created by fund distributors to promote common supervisory approaches and practices in the application of the UCITS Directive and its implementing measures. (more info). Morningstar Star Rating This is a proprietary Morningstar data point. Mutual funds are rated 1 to 5 stars based on risk-adjusted rate of return. It takes into account the sales charges and compares similar funds in a category. The rating is based on 3, 5 and 10 years of performance history. (more info).
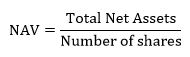
Category: This is a proprietary Morningstar data point. Morningstar assigns funds into categories based on their portfolio statistics and compositions over the past three years (more info). This is useful for investors and investment professionals in order to perform meaningful comparisons between funds. NAV – Net Asset Value of a fund represents its per-share price and is calculated as shown below (more info).
NAV Date - Date of the last updated NAV value NAV - Last Net Asset Value. Clicking on 'NAV' header opens the historical NAV overview Type - The asset class of a fund. Category - Official Morningstar categories. Each fund is assigned to a unique category that the fund is compared to in terms of its performance and risk indicators. Start - The inception date of the fund. Performance - The table displays End of Month (EoM) data for following time-periods YTD, 1M, 1Y, 3Y and 5Y for the fund, reference index and for the category of the fund. Rank in category % - Shows the percentile rank of the fund in a category. Risk - The table provides an overview of the fund's risk profile. Risk values are always in the subscription currency of the fund (NAV currency). Risk level (SRRI) - Synthetic Risk Reward Indicator - indicates the risk level of the fund. 1 meaning low risk, 7 meaning high risk. The risk score is based on historic data and should be viewed as an indicator only. Standard deviation – the Total Risk of Return as calculated by Morningstar (more info). Sharpe Ratio – Risk-adjusted return as calculated by Morningstar (more info). Available for sale in - Displays the markets that a fund is available for sale in. Information Ratio – A risk-adjusted performance measure. The information ratio is a special version of the Sharpe Ratio in that the benchmark doesn't have to be the risk-free rate. Monthly:
Annualized:
er = expected return TE = Tracking Error n = number of periods
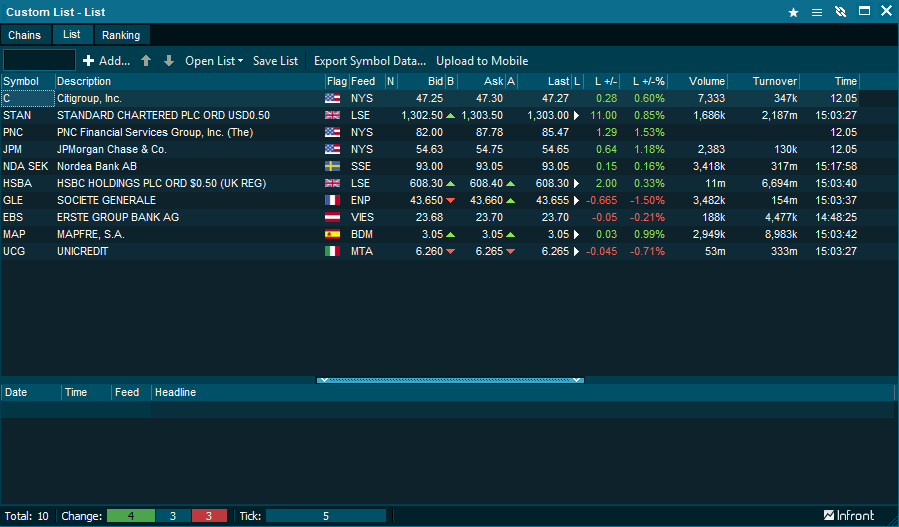
Alpha – The excess return as calculated by Morningstar. Beta – The market risk as calculated by Morningstar. Top Holdings - displays the Top 10 holdings of the fund, their weighting, currency and market prices. Positive market value depicts a long position in a holding, a negative value depicts a short position in a holding. Clicking on the heading 'Top Holdings' opens a composite window with all the respective holdings and market data: Click on each holding to navigate to an overview of each instrument. For listed companies, a Company overview is opened containing fundamental data, peer analysis, consensus estimates, etc. Asset allocation - Provides information about funds' holdings in different asset classes. Asset allocation can be over 100% - this is due to short/long positions in the funds' portfolio. Portfolio Statistics - Price to book Fund graph - shows historical performance of the fund for the past 5 years. The Morningstar reference index is also displayed in the graph after being re-based. Clicking on the graph will open the advanced charting functionality allowing to perform further analysis. Exposure WindowTop countries – The table lists top 10 countries that the fund is invested in and their weights in descending order. Top sectors – The table lists sector exposure of the fund. In some cases however, the total might not add up to 100%. This is due to the fact that not all the funds report their holdings fully. Style map equity - The Morningstar Style Box is a nine square grid that classifies funds by size along the vertical axis and by value and growth characteristics along the horizontal axis. Read more about Morningstar Style Box.
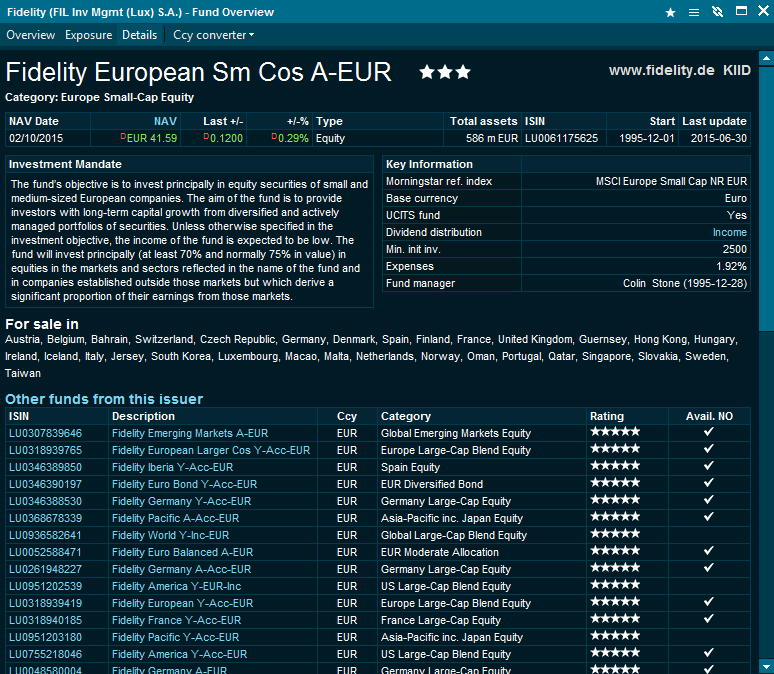
Details window The details tab provides key information as well as the fund’s investment objective.
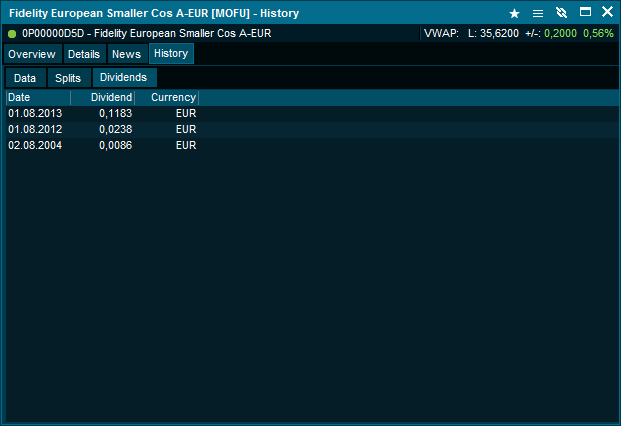
Dividend distribution - Accumulation - funds that reinvest dividends back to the fund. Income - funds that pay dividends out. For Income funds, user can click on 'Income' and get an overview of all the previously paid out dividends.
Expenses - The total expenses of the fund. Other funds from this issuer - The table shows other funds that the issuer offers in the same currency as the current fund. User can open a Fund Overview for funds in the list by double-clicking on a fund. Click on the heading of the table which will then open the search window where you can further screen and adjust the search filters. |