What's New in 5.2


What's New in 5.2 |
|
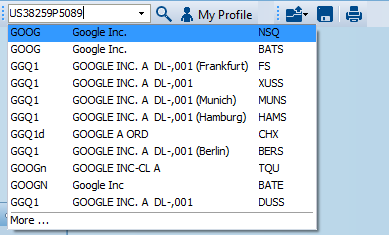
SearchThe main searching functionality has been completely redesigned for usability and speed. Instant search has been enabled with a new ranking system to improve search results. Toolbar searchToolbar search will now show suggestions as you type, and the string matching the search text will be in bold. The results are ranked to show the most popular results at the top of the list. For more search options, click "More" to enter the search window. You can also include parts of the feed name in the search, e.g. "AAPL BATS". Pressing Ctrl+F will enable the Toolbar search field. From a market window or list, it is now possible to drag and drop an item into the search field to perform an ISIN search on the instrument. ISIN search can be useful when looking for the same instrument on other markets.
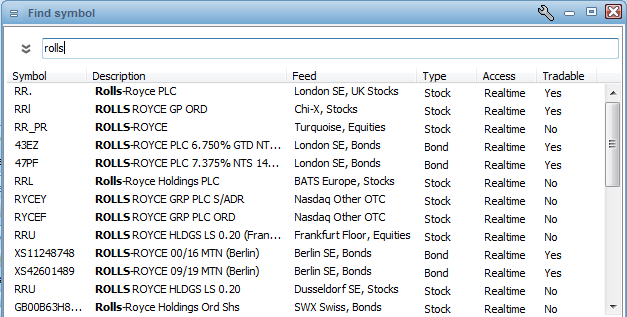
Search windowThe main search window has been simplified to one search field that quickly will give you search results while typing. Word matches will be shown in bold. To access the advanced menu press the arrow button next to the search field.
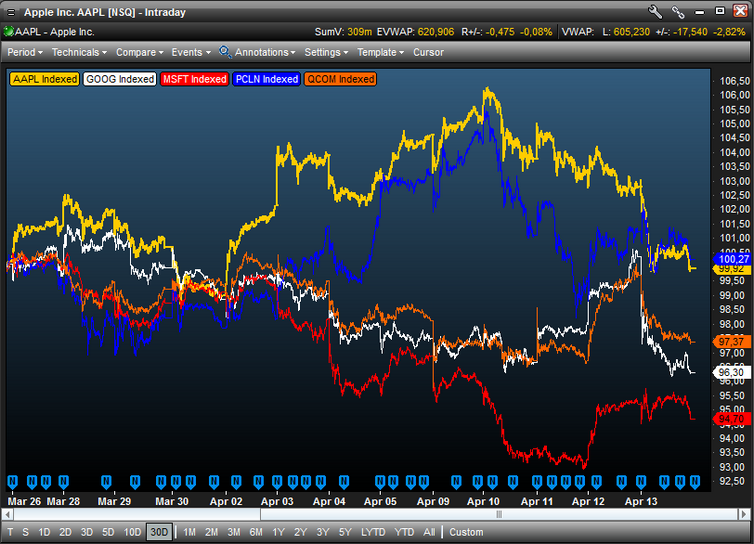
ChartingThe charting module has been vastly improved in areas such as performance, look and feel, usability and new features. For a full overview of the charting module and improvements go to the Charts section
New toolbar menuTo make the charting module simpler to use, the toolbar menu is now compiled to the top of the chart. Technicals and Compare studies will now remember your latest selections, and events such as; news, adjustments and trades are easily selectable from the drop down menu. PeriodIn the period selection you select the time series of the chart for both historical and intraday data. By selecting "custom" it is possible to customize the time series and resolution. TechnicalsIn the technicals menu there is a default list of 10 common studies, to access all studies press the more button or "Insert". If studies not in the default list are chosen, the most recently used will appear above the default list. The most recently used will also be available in new chart windows. CompareCompare studies are available from the drop down menu, the latest used compare studies are also available in this menu. EventsNews, Adjustments and trading events will now show up in the bottom of the chart. Clicking a news item will open a quick headline reader. Multiple adjustments on/off per instrument in compare charts are now possible. Chart TemplatesIt is now possible to create own chart templates for different purposes in addition to templates provided from Infront. There is a selection of templates added to show the new possibilities in the charting module. New legendThe new legend allows the end user to quickly modify and remove studies from the chart. New zoom scrollbarHandles on both sides of the bar to adjust time periods, and only one bar to simplify use. The new zoom scrollbar works very well with the new ranged values:
Ranged valuesNew values are added to the top of the chart menu, these values reflect the time period selected in the chart.
WatermarkWatermarks are now supported, it is possible to choose between ticker code or description. New studies
Other chart features:
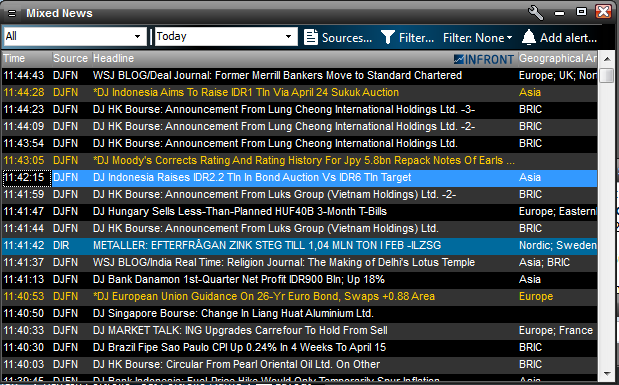
NewsSeveral improvements have been done to the News window. Bold textWhen filtering on text in headline, matches will appear bold in the mixed news window Background color for news sourceIt is now possible to select a background color for news items from specific news sources.
Bar ChartCustom time periodsBar charts now support custom time periods from the compare menu, making it simple to create personalized performance charts. Market WindowNew ColumnsIn the market window the following columns are now available:
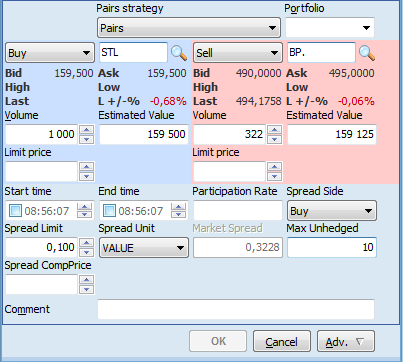
News columnNews column in market window now shows a new popup window with news grid when clicked. ScreensScreens button now has a drop-down with the most relevant screens for your region. TradingConsolidated order windowsThe new order window and the click trading window now supports consolidated feeds, which allows you to view available consolidated data by right clicking or using the shortcut Ctrl+G ). When these windows are in consolidated mode a Σ will appear before the Bid and Ask size columns. Pairs TradingThe terminal now supports Pairs trading. A new window for Pairs trading has been added, in addition a Pairs tab is also available in the trading overview. Note that Pairs trading require explicit support from your broker's servers.
Unicode SupportThe application now supports Unicode giving several advantages such as the possibility to view news in many different languages at the same time. |