Yield Line Chart


Yield Line Chart |
|
|
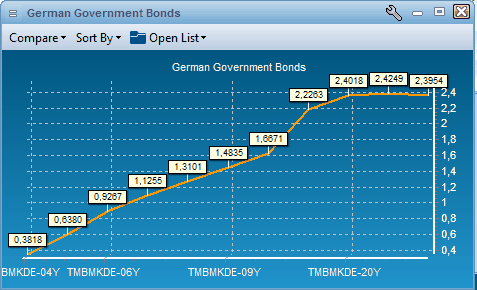
Description The yield line chart displays one or more instruments side-by-side in a single line chart. As a default it will display the selected instruments net change in percent. It can be configured to chart a number of historic values in order to quickly see the performance. How to access
|